Tax-benefit systems, income distribution and work incentives in the European Union
- University of Essex and University of Leuven, United Kingdom
- University of Essex, United Kingdom
Abstract
In this paper we study the impact of tax-benefit systems on income inequality and work incentives across the 27 Member States of the European Union (EU). Using EUROMOD, the EU-wide tax-benefit microsimulation model, we disentangle the role of taxes, benefits and social insurance contributions in influencing country specific Gini coefficients and Marginal Effective Tax Rates. The extent to which tax-benefit systems contribute to income redistribution and provide work incentives at the intensive margin is found to vary considerably across the 27 Member States of the EU. Our results further highlight the presence of a trade-off between income redistribution and work incentives across EU-27 countries.
1. Introduction
Aspects such as the degree of progressivity of income taxes, the relevance of means-tested benefits and government approaches towards redistribution characterise the great variety of tax-benefit policies observed in EU countries and their role in the formation of household disposable income. In this paper, we analyse the role of tax-benefit systems in affecting the income distributions and work incentives across all 27 EU Member States, and we explore the presence of a trade-off between income inequality and work incentives at the EU level. Our analysis makes use of EUROMOD, the EU wide tax-benefit microsimulation model.
The effect of tax-benefit systems on income inequality has been subject to extensive academic research. Macro indicators, such as the share of social expenditures in GDP, have been traditionally used in international comparative studies to analyse the effect of the welfare state on poverty and inequality (Castles & Mitchell, 1992; Korpi & Palme 1998). More recently, research based on national micro-data has progressively expanded, allowing for a better representation of the distributional impacts of tax-benefit systems. Efforts have been made to harmonize national micro datasets in order to improve cross-country comparability. In fact, many recent comparative studies on income inequality rely on harmonized datasets such as the Luxembourg Income Study (Mahler & Jesuit, 2006; Lambert et al. 2010; Wang et al. 2012) or the European Union Statistics on Income and Living Conditions (EU-SILC) (Fuest et al. 2010).
Despite the improvements in terms of cross country comparability provided by harmonized micro-data, taxes and benefit information provided by surveys could be too restrictive. Detailed information on specific tax-benefit instruments is, in fact, often not available in such surveys, and the time lag that characterise the release of the micro-data can be a limitation, in particular when important policy reforms have been implemented between the period analysed and the data release. An alternative approach consists in using harmonized micro-data together with a tax-benefit microsimulation model. Besides the advantage of providing more detailed information, microsimulation could also improve the measurement of some income components not well captured in surveys (Figari et al. 2012) and allows the study of very recent policy years (Avram et al. 2013). Our analysis draws on previous work about redistributive effects and work incentives using EUROMOD, the EU wide tax-benefit microsimulation model (Immervoll 2004; Immervoll et al. 2006; Paulus et al. 2009; Avram et al. 2012).
Tax-benefit systems play a primary role in influencing work incentives. A distinction is usually made between incentives to work versus not working and incentives to work more for those already in work. It is common practice to refer to these as incentives at the extensive and intensive margin of labour supply, respectively. Participation Tax Rate (PTR), defined as 1 minus the financial gain to work as a proportion of gross earnings, measures the financial gain from working versus not working. PTRs are, hence, an indicator of the work incentives faced at the extensive margins of labour supply (Brewer et al. 2010). Marginal Effective Tax Rates (METRs) provide a measure of the share of additional income that would be taxed away because of taxes, social insurance contribution and benefit withdrawal. Computed over changes in labour income, METRs are a commonly used indicator of the incentives faced by a worker on the intensive margin of labour supply. The analysis of work incentives conducted in this paper focuses only on Marginal Effective Tax Rates, and hence on the financial incentives given by the tax and benefit system to people currently in work. The analysis offers a first insight into the work incentives embedded in tax and benefit systems across all 27 EU countries.
The responsiveness of labour supply to financial incentives has been widely studied in the literature. Meghir and Phillips (2010), in their review of the literature, show that specific population groups, such as women with young children and in particular lone mothers, seem to be highly responsive both at the intensive and at the extensive margins of labour supply. Males do not significantly adjust the number of hours worked according to the financial incentives given by the tax-benefit systems, but the participation decision of low skilled males is affected by them.1 However, Meghir and Phillips note that decisions about participation and numbers of hours worked are only two of the possible dimensions of responsiveness. Some people might in fact be able to change the effort they put into their job and hence vary their wages; some others might choose to change jobs. The “new Tax Responsiveness” approach relaxes the assumption that effort can be perfectly measured by number of hours worked, and it focuses on the response of taxable income to the marginal tax rate as an indicator of behavioural responses to taxation. In addition to effort and hours worked, the concept of behavioural response typical of this approach includes other dimensions of response such as reallocation of income between sources or changes in tax deductible consumption. The literature reviewed in Meghir and Phillips (2010) and in Saez et al. (2012) shows that taxable income significantly responds to taxation, especially for high-skill and high-income individuals.
Microsimulation techniques represent an essential tool for the calculation of METRs. Crosscountry studies have already presented analysis of METRs for EU countries. Among others, Carone et al. (2004) use the OECD “synthetic family” based tax-benefit model to analyse the presence of low wage, unemployment or inactivity traps among a selection of countries including EU Member States, a range of Candidate countries (at the time of their writing) and some non-EU countries. Their results show a higher likelihood of a low-wage trap for households living in countries “where means-testing has traditionally played an important role in the benefit system” (Carone et al. 2004).2 Immervoll (2004) presents a EUROMOD based analysis of the distribution of METRs for 14 EU countries decomposing the effect of benefit withdrawal, and increase in taxes and social insurance contribution liabilities. In view of the descriptive aim of this work, two features make EUROMOD more suitable than “synthetic family” models for our analysis: results are representative at the population level; and it is possible to perform distributional analysis of the indicator of interest.
The paper is organised as follows. Section 2 introduces the methodology used in our analysis, with a focus on the data and the role of EUROMOD (2.1), on the techniques used for the analysis of income distributions (2.2) and on the way METRs are calculated and decomposed in the context of this paper (2.3). Section 3 presents our main results in separate subsections. First, the relative size of tax-benefit instruments across EU countries is discussed. Second, the effect of tax-benefit systems on income inequality is studied. Then the role of taxes and benefits in affecting financial work incentives is analysed through the study of METRs, with focus on their distribution, their composition and their variation between 2007 and 2010. Finally, the relationship between income inequality and work incentives across EU countries is discussed. Section 4 concludes.
2. Methodology
2.1 EUROMOD and the Data
Our analysis makes use of EUROMOD, the tax-benefit microsimulation model for the European Union, which provides cross country comparable measures of direct taxes and social insurance contributions liabilities, as well as cash benefit entitlements for the household population of all 27 EU Member States. EUROMOD is a static microsimulation model, meaning that behavioural responses to policy reforms are not taken into account and socio-demographic changes are not considered. Instruments which are not simulated in EUROMOD are taken directly from the data, when available. See Sutherland and Figari (2013) for further information.
The underlying micro-data used for the simulations in EUROMOD reported here come from the 2008 European Union Statistics on Income and Living Condition (EU-SILC).3 Exceptions to the use of EU-SILC 2008 concern France, where EU-SILC 2007 is used; Malta, where EU-SILC 2009 is used; and the UK where the 2008/09 Family Resource Survey (FRS) is used.
Currently, policy years 2005 to 2010 are covered in EUROMOD, for the purpose of tax-benefit simulations.4 In this study, the tax and benefit rules used are those in place on the 30th of June 2007, when we refer to 2007 systems, and 30th of June 2010, when we refer to 2010 systems. For most countries, the 2007 policy system matches the income reference period of the underlying micro-data, since EU-SILC 2008 reports income from the previous year.
When simulated policy systems refer to a year that is different from the underlying micro-data income reference period (e.g. 2010 policy systems for all countries), non-simulated income variable are updated using country and income specific updating factors.5 An example can be useful to clarify this point: between one year and another wages changes, and not taking this into account might cause serious problems in the simulation of various instruments (e.g. income tax and social insurance contributions); EUROMOD captures the changes of the non-simulated monetary variables updating their values according to suitable indicators (e.g. wage growth rate for wages).
In most countries, simulation of taxes and benefits is based under the assumption of full compliance with policy rules and 100% benefit take-up. Under such assumptions, simulations tend to overestimate the amounts of taxes and benefits and hence underestimate inequality of disposable income. The extent to which these problems occur varies across countries. For this reason, adjustments have been made in some cases. Non take-up of certain benefits has been modelled for Belgium, Estonia, Greece, France, Ireland, Poland, Romania and the UK, while tax evasion has been accounted for in Bulgaria, Greece and Italy.6 While accounting for benefit non take-up and tax evasion is reasonable for a cross-country comparison of income inequality, the assumption of full compliance is more adequate for the study of the “intended effect” of the tax and benefit system on labour market incentives. For this reason, adjustments for tax evasion and benefit non take-up are not taken into account for the calculation of METRs.
2.2 Income distribution
In our analysis, equivalised7 household disposable income is used to evaluate household resources. Disposable income is the result of adding original household income to any social transfers and deducting direct taxes and social insurance contributions. Original household income includes earnings, income generated by assets, private pensions, investment and capital income, and transfers from other households. Taxes include income tax and other direct taxes. Social insurance contributions refer to employee and self-employed insurance contributions and social transfers include means-tested and non means-tested benefits, as well as public pensions.
In order to analyse the redistributive effect of tax-benefit systems, we use the standard Gini coefficient to measure income inequality. Similar to previous studies using EUROMOD (Immervoll et al. 2006; Paulus et al. 2010; Avram et al. 2012), we measure the redistributive effect of different tax-benefit instruments, by comparing Gini coefficients before and after taxes and/or benefits.
It is important to stress that interactions between instruments are not accounted for in the analysis, when different tax-benefit components are excluded from disposable income. The exercise consists therefore of a static decomposition. For instance, we ignore that excluding benefits might cause a decrease in taxes, as some benefits are taxable; and that the absence of non means-tested benefits in the systems might result in an increase of recipients of means-tested benefits. This is equivalent to the usual methodology used for analysis directly from micro-data (Mahler & Jesuit, 2006; Fuest et al. 2010).
2.3 Calculation of METRs
Marginal Effective Tax Rates (METRs) are a measure of the incidence of the tax and benefit system on a marginal increase of earnings. They are, in particular, an indicator of the proportion of a marginal increase in earnings that is taxed away due to social insurance contributions, taxes and loss of benefit entitlement. This feature makes METRs a popular indicator of the incentives faced by a worker on the intensive margin of labour supply.8
Because of the complexity of tax and benefit systems, it is possible that a variation in earnings not only affects the disposable income of the individual whose earnings change, but also benefit entitlements or tax burden of other members of the household. Therefore, METRs for each individual are evaluated taking into consideration taxes paid by, and benefits paid to, all members of a household and affecting household current cash disposable income.9
Individual level METRs are calculated according to the following formula:
where the numerator measures the change in household disposable income before
The calculations are performed by EUROMOD through the following steps: first, household disposable income is calculated; then individual earnings are increased in turn for each earner in the household and the corresponding household disposable incomes are computed. METRs are hence calculated and assigned to the individual whose earnings have been increased. Consider the following example: assume two earners, i and j, are part of a household. Earner specific marginal effective tax rates are calculated as follows. First, household disposable income
Moreover, disposable income can be decomposed as the arithmetical sum of original incomes (O) (Incomes before any tax and transfer), benefits and pensions (B) minus taxes (T) and social insurance contributions (S). Equation (1) can hence be rewritten as:
Since the change in original incomes is equal to the change in earnings, the expression can be further rewritten as:
where the first component reports the reduction in benefit and pensions at the household level as a percentage of the earnings increase; the last two components report the increase in taxes and social insurance contributions as a percentage of the earnings increase.
In the context of this analysis, the marginal increase applied to earnings is set equal to 3% of total earnings. The choice of this margin is due to the fact that extra 3% earnings roughly corresponds to an extra working hour per week for a worker working 40 hours per week.
In theory marginal tax rates are usually expected to take values between 0% and 100%. Many aspects of tax and benefit systems make METRs outside this interval a possibility. It is possible, for example, to have METRs above 100 if the marginal increase in earnings causes the loss of some benefit entitlement. In some cases the reduction in benefit overcomes the increase in earnings, causing household disposable income after the increase in earnings to be lower than the household disposable income before it. Negative values of METRs might arise from tax allowances or benefit entitlements that are only paid to people with income above a given threshold; as reported in Immervoll (2004), those with income just below the threshold will see their household disposable income increase more than earnings do, resulting in a negative marginal effective tax rates.
Being an indicator of the incentive faced at the intensive margin of labour supply, Marginal Effective Tax Rates are only calculated for those reporting positive earnings in the underlying survey data. Following Immervoll (2004), we choose to focus our calculation on a sub-sample of earners: those aged 18-64. Excluding people below and above the age thresholds allows us to focus on incentives faced by the working age population. We further restrict this sub-sample to those with more than 1 unit of national currency of monthly earnings.10 Finally, in order to reduce the risk of our calculations being biased by “outliers”, we exclude from our calculations the top percentile of the METR distribution if the METR is above 150% and the lowest percentile if the METR is negative. Although METR values of observations considered “outliers” are plausible, we exclude them from our analysis as they are likely to bias our calculation of average METRs, especially when deciles specific measurements are performed.
3. Results
3.1 Relative size of tax-benefit instruments
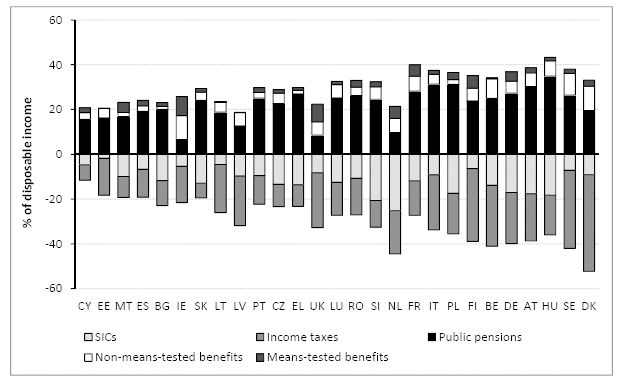
Before analysing the effect of tax-benefit instruments on income distribution and work incentives, it is worth considering the extent to which different tax-benefit components vary in size on average across countries in Europe. Figure 1 shows the relative size of five tax-benefit components for EU-27, where the average size of each income component is measured as a percentage of average household disposable income.11 Taxes and social insurance contributions are shown as negative values as they represent deductions from disposable income.

Tax-benefit components as share of household disposable income: all households (2007 policies).
Note: Countries ranked by the size of their tax-benefit system.
Source: EUROMOD version F6.20.
Note that the size of the redistributive system in each country could be roughly measured by the total length of the bars in Figure 1, which represents the sum of all tax and benefit components. Using such indicator, we observe a substantial variation of the size of tax-benefit systems across EU countries. Cyprus ranks particularly low in terms of the size of the redistributive system, while Nordic countries (Denmark, Sweden and Finland) and continental countries such as the Netherlands, Belgium, Germany and Austria, as well as Hungary, are the highest ranked. These results are consistent with previous studies using EU-SILC and EUROMOD (Immervoll et al. 2006; Paulus at al. 2009; Fuest et al. 2010; and Avram et al. 2012).
In terms of deductions, income taxes are in general more important than social insurance contributions, with some exceptions such as Czech Republic, Greece, the Netherlands, Slovakia and Slovenia. Nordic countries (Denmark, Sweden and Finland) and Belgium present particularly high shares of income taxes, while Czech Republic, Greece, Malta, Cyprus and Slovakia rank among the ones with lowest shares. Taking into account both income taxes and social insurance contributions together, taxation ranges between 12% of disposable income in Cyprus and 52% in Denmark.
From the benefits side, public pensions represent by far the largest component, except in Anglo-Saxon countries (Ireland and the UK). The relative size of pensions is particularly important in Austria, Poland, Italy and Hungary, where they account for over 30% of household disposable income. Besides Ireland and the UK, the Netherlands also has a small share of public pensions, which is related to the prominent role of private and occupational pension schemes in these countries. In general, non means-tested benefits represent only a small part of disposable income, except in Denmark and Ireland where they amount to more than 10%. Means-tested benefits represent, on average, an even smaller share of disposable income (less than 5%), except in the UK and Ireland. Among other countries, where means-tested benefits represent an important component of social benefits, we observe the Netherlands, France and Finland.
The relative size of different tax-benefit components varies for individuals in different parts of the income distribution. In general, taxes tend to be progressive and some types of benefits are targeted to groups with low incomes. In order to consider such variation, we replicate the previous analysis for the bottom and top deciles of the income distribution in the EU-27 countries.
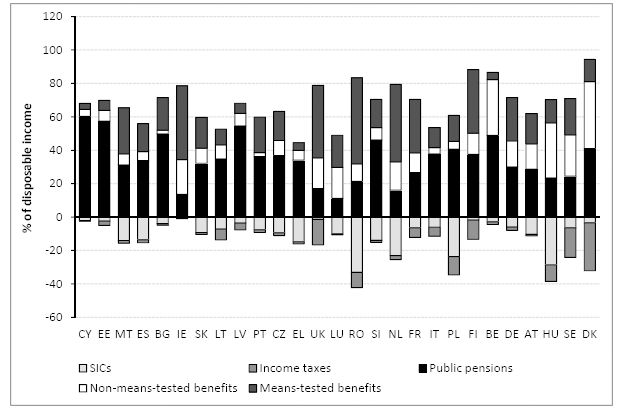
Figure 2 presents the relative size of tax-benefit components for households in the bottom decile of the distribution. As expected, the relative size of benefits is more important among this group of the population. In 20 out of the 27 countries analysed, benefits together with public pensions represent more than 60% of household disposable income. Even in Greece, where the share of social benefits and pensions is the lowest, it amounts to a considerable 44% of disposable income. Besides pensions, means-tested benefits represent now an important share of disposable income, ranging between 3.5% in Cyprus and 51.4% in Romania. Non means-tested benefits are in general lower, except in Sweden, Belgium, Hungary and Denmark.

Tax-benefit components as share of household disposable income: bottom decile (2007 policies).
Note: Countries ranked by the size of their tax-benefit system.
Source: EUROMOD version F6.20.
Taxes and social insurance contributions represent a much lower share of disposable income in the bottom decile of the distribution. Some exceptions are Denmark and Sweden where many benefits are taxed; and the UK, where most of the tax consists of Council Tax (which is offset by a benefit for those on low incomes). Few countries are also characterised by high shares of social insurance contributions. This is the case of the Netherlands, where contributions are payable on benefits; Hungary, where this is related to high contributions paid by the self-employed who are under a simplified taxation regime; Poland and Romania.
Turning to the top of the income distribution, Figure 3 shows that the relative size of taxes and benefits is reversed, with respect to the picture of the bottom decile. As expected, now taxes and social insurance contributions represent the main income components. In all countries, the share of taxes and social insurance contributions is greater than the share of benefits received. The only exception is Cyprus, where public pensions12 are an important component of household income at the top decile. Total deductions (direct taxes plus social insurance contributions) are particularly important in Belgium and the Netherlands, where they represent over 60% of disposable income, while in Cyprus they account for less than 20%. The share of social benefits consists mainly of public pensions. The lowest share of social benefits is found in the Netherland and the UK, while Hungary, Italy and France have social benefits of over 30% of disposable incomes, which mostly corresponds to public pensions.
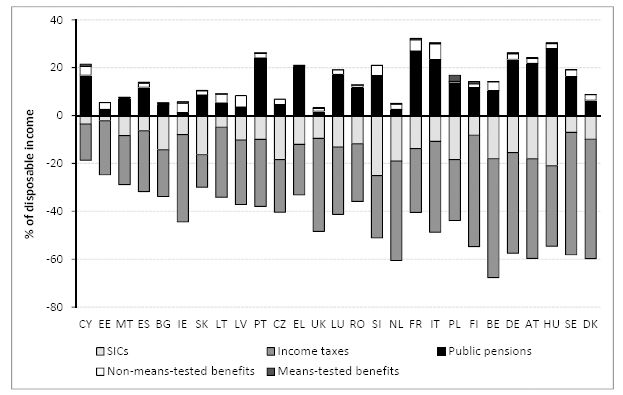
Tax-benefit components as share of household disposable income: top decile (2007 policies).
Note: Countries ranked by the size of their tax-benefit system.
Source: EUROMOD version F6.20.
3.2 Redistributive effects of tax-benefit instruments
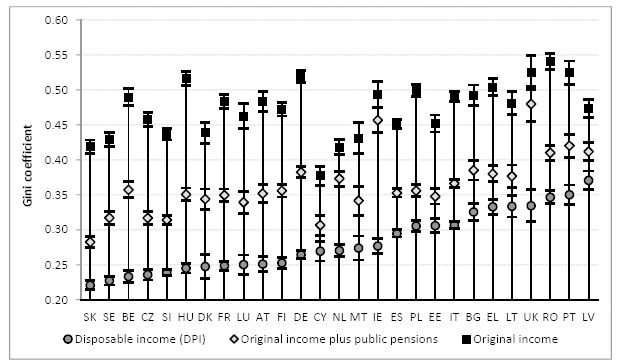
One of the roles of tax-benefit systems is to reduce income inequality (Boadway & Keen, 2000). In this section, we analyse the extent to which the redistributive effect of taxes and benefits, varies across European countries. Figure 4 presents Gini coefficients for household original income (before benefits receipt and tax-contribution deductions), original income with public pensions and disposable income for EU-27 countries. Each income measure is equivalised using the modified OECD scale. Countries are ranked by Gini coefficients of disposable income. Confidence intervals for Gini coefficients, calculated using bootstrapping techniques (with 1000 replications), are also included in the graph.

Income inequality before and after taxes and benefits as measured by the Gini coefficient.
Source: EUROMOD version F6.20
Inequality in terms of household disposable income is low (Gini between 0.21 and 0.25) in Nordic countries (Denmark, Sweden and Finland), some continental countries such as Belgium, France, Luxembourg and Austria, as well as in Slovakia, Czech Republic, Slovenia and Hungary. Among countries with high inequality in disposable income (Gini between 0.31 and 0.34) we observe Southern countries, such as Italy, Greece and Portugal; Eastern European countries such as Bulgaria, Latvia, Lithuania, Poland and Romania, and the UK.
The difference between Gini coefficients for original income and disposable income represents the total redistributive effect of tax-benefit systems. Tax-benefit systems have a significant effect on reducing inequality, although to a different degree across countries. In most countries, public pensions have a stronger effect in reducing income inequality than the remaining tax-benefit instruments combined. The only exceptions are the Netherlands, Ireland, the UK; and to a lesser extent Denmark. Comparing Gini coefficients of original income plus pensions and disposable income, we observe that tax-benefit systems play an important role in reducing inequality in Belgium, Germany and Anglo-Saxon countries (UK and Ireland). The smallest effect of tax-benefit systems (excluding pensions) is found in Cyprus, Estonia, Latvia and Lithuania.
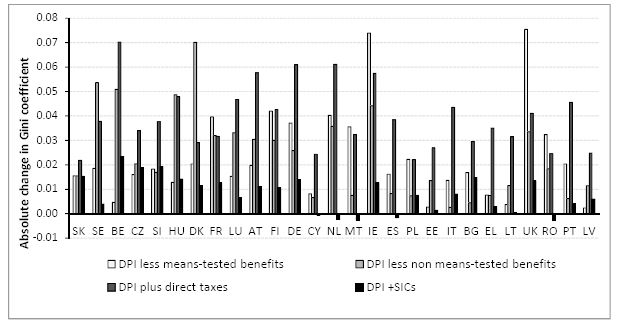
In order to have a better idea of the contribution of different tax-benefit components to reducing inequality, we calculate Gini coefficients excluding each instrument individually from disposable income. Figure 5 shows the absolute change in Gini coefficient of disposable income when each instrument of the tax and benefit system is excluded. As previously said, our results do not take into account interactions between instruments within the tax-benefit system, when different components are excluded in order to recalculate Gini coefficients.

Redistributive effect of tax-benefit instruments, absolute change in the Gini coefficient.
Source: EUROMOD version F6.20
In most countries, direct taxes tend to be the most important instrument in reducing inequality ranging from an absolute change of about 0.02 in Slovakia to 0.07 in Belgium. In Ireland and the UK, means-tested benefits play a major role on income redistribution, accounting for an absolute change in Gini of 0.075 points. Other countries, where means-tested benefits dominate the effect of direct taxes are France, Malta and Romania. Non means-tested benefits, on the other hand, are particularly important in Denmark, Sweden, Belgium and Hungary. Finally, in most countries social insurance contributions reduce inequality but in a rather small degree, while in very few cases (Netherlands, Spain, Malta, Cyprus and Romania) inequality increases, which could be related to contributions being payable on benefits or to the presence of low caps on contributions (Avram et al. 2012).
3.2.1 Changes in income inequality across 2007 and 2010 policy systems
In this subsection, we briefly describe the effect of policy changes between 2007 and 2010 on income inequality. For this purpose, 2010 policies are simulated with the same input data used for the analysis of income inequality in 2007. Labour market characteristics are, hence, kept fixed with the aim of isolating the effect of policy changes. As described in Section 2.1, an updating process of the monetary variables not simulated in EUROMOD is performed. As such, the analysis presented in this section represents a static microsimulation exercise, where behavioural responses to policy changes are not accounted for.
Figure 6 presents Gini coefficients in policy years 2007 and 2010. In most countries income inequality falls or remains the same. Latvia, Ireland and Estonia are the countries where inequality decreases the most, while Hungary and Poland present the highest increase (around one percentage point). Note that, by abstracting from changes in population characteristics and behavioural responses, the changes in Gini coefficients estimated by EUROMOD represent the effect of policy changes on income inequality. However, some of the changes across countries and over time are also affected by the way incomes are uprated (Jara, Sutherland et al., 2013). In this sense, our estimates are measuring the effects of policy changes relative to income growth.
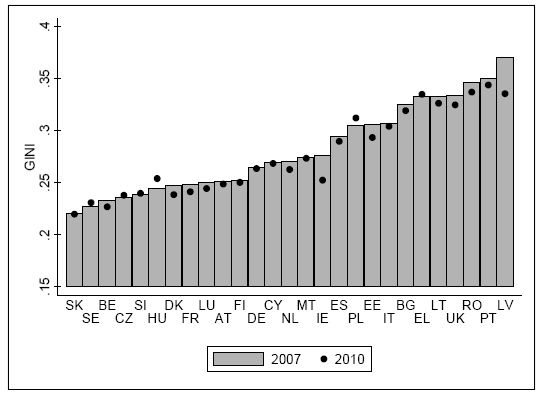
Changes in income inequality 2007–2010.
Note: Countries ranked by Gini coefficient in 2007.
Source: EUROMOD version F6.20.
3.3 Marginal Effective Tax Rates
3.3.1 METRs across countries
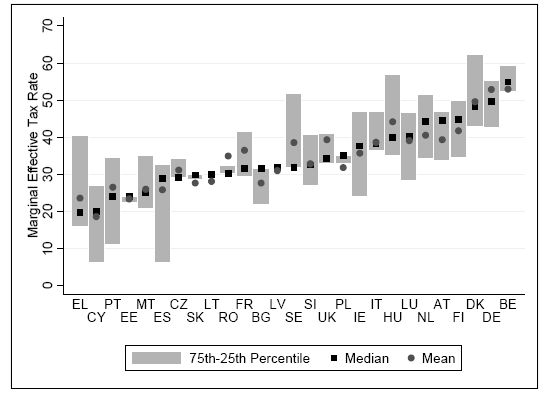
Figure 7 shows the METR distribution across the EU, with a focus on country specific median, mean, as well as the 25th and 75th percentiles. Countries are ordered according to median METRs. Table A1 in the Appendix provides information on METRs distribution across the 27 EU countries.

Marginal effective tax rates across the EU, 2007 (%).
Note: Countries are ranked by the median METR.
Source: EUROMOD version F6.20.
Our calculations show that the country specific median METR, as well as the mean, varies widely across countries, ranging from relatively low values in Greece and Cyprus (close to 20%) to relatively high values in Belgium, Germany and Denmark (close to 50%). The reasons for such differences are analysed later in this section when a decomposition of the mean country specific METRs is presented. The results are largely in line with those shown in Immervoll (2004).
Figure 7 also highlights important differences in the within country distribution of METRs. In some cases the distance between the 25th and 75th percentile of the METRs distribution is quite narrow, in particular for “flat tax” countries like Estonia, Lithuania or Latvia; in some other countries the distribution is wider mainly due to a greater degree of progressivity in the income tax schedules.
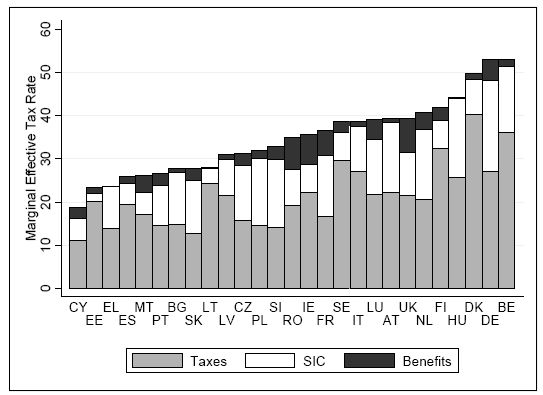
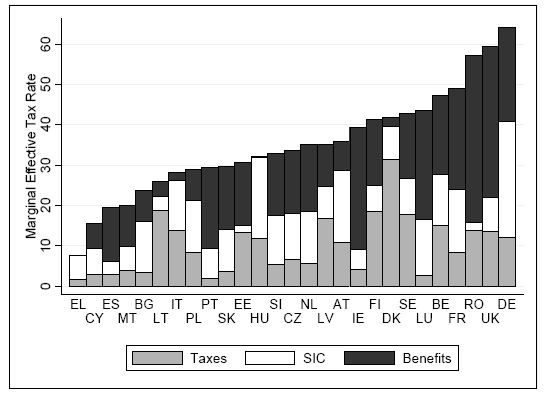
The decomposition by components of the country specific mean METR is shown in Figure 8.

Mean marginal effective tax rates decomposition by income source across the EU, 2007 (%).
Note: Countries are ranked by the mean METR.
Source: EUROMOD version F6.20.
Mean METRs have been decomposed into a tax component, describing the mean of the increase in taxes paid at the household level as a proportion of the increase in individual earnings; a social insurance contribution component, including both variation in employee and self-employed social insurance contribution; and a benefit component, measuring the mean of the reduction in benefits and pensions paid at the household level as a proportion of the increase in earnings.
Despite a wide variation across countries, the graph shows that the tax component is usually the most important, the size of it varying significantly across countries and ranging from relatively low values in Cyprus, Slovakia and Greece to relatively high values in Belgium and Denmark.
Social insurance contributions are the second most important component of the mean METR, ranging from just below 2% in Estonia to above 18% in Hungary and Germany. It should be noted that social insurance contributions paid by the employer are not included in the calculation since they do not represent a source of variation of household disposable income. Finally, the benefit withdrawal component is the smallest, with sizable effect mainly in France, Ireland, Romania and UK, countries characterised by important means-tested benefits.13
In order to better appreciate the relevance of benefit withdrawal, Figure 9 reproduces the mean METR decomposition for the lowest two deciles of the equivalised household income distribution. People in the lower part of the income distribution are in fact more likely to receive means-tested benefits. The benefit withdrawal due to the increase in earnings is captured by higher values of the benefit component of the METRs.

Mean marginal effective tax rates decomposition across the EU, Lowest two deciles of the income distribution, 2007(%).
Note: Countries are ranked by the mean METR.
Source: EUROMOD version F6.20.
The relevance of the benefit withdrawal component increases in almost every country and in many of them (i.e France, Ireland, Romania and UK) it becomes the main component of METR. From a comparison between Figures 8 and 9 it also emerges that there is a sharp reduction of the size of the tax component among those in the first two deciles of the income distribution.
As discussed in Section 2.3, METRs can only be calculated for people currently in work. The figures reported in this and in the following sections hence take into account only indirectly of variations in benefits received or taxes paid by people currently not in work (e.g. trough the variation of the household disposable income following an increase of the labour income of the other earners in the household). In some countries, for example, we would see an increase in the size of the benefit withdrawal component if some labour income would be given to people currently out of work. However, a different sort of incentives would be analysed in that case, namely incentive faced on the extensive margin of the labour supply, and this goes beyond the purpose of our analysis.
3.3.2 High METRs and income distribution
High levels of METRs are an indicator of low incentives to increase labour supply (or to work for marginally higher wages) since a high proportion of the extra earnings would be taxed away because of extra tax and social insurance contribution or benefit withdrawal. A comparison between Figures 8 and 9 shows that in some countries (i.e. France, Romania and UK) average METRs in the lowest two deciles of the income distribution are higher than the population averages, while the opposite is true for other countries (i.e. Greece, Spain and Italy).
In this section, the distribution of high METRs across the income distribution is analysed using a subsample of countries in order to describe the two most common patterns across EU member states. The threshold used to identify a “high” value of METR has been set to 50%. This choice is the result of a trade-off between plausibility and number of observations with METRs above the threshold. On the one hand, the higher the threshold the more plausible it is that Marginal Effective Tax Rates above it discourage an increase in labour supply; on the other hand, the higher the threshold, the lower the sample number of workers with METRs above it, and the less representative the analysis would be.
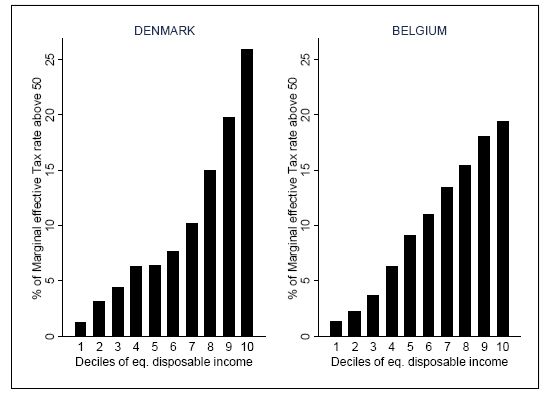
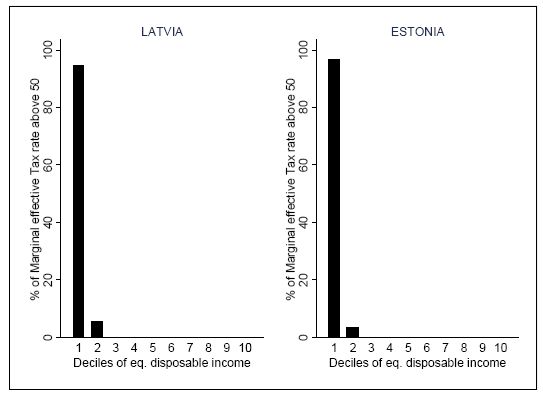
An analysis of the distribution of high METRs shows two prevalent patterns across the EU member states: a first one in which people facing high METRs are mainly in the upper deciles of the income distribution (Figure 10) and a second one in which high METRs are concentrated in the lower deciles (Figure 11 and Figure 12) . Table A2 in the Appendix provides information on high METRs distribution across the 27 EU countries.

Proportion of high METR by deciles of equivalised disposable income, 2007.
Note: Proportion of METRs above 50% across deciles of income distribution.
Source: EUROMOD version F6.20.

Proportion of high METR by deciles of equivalised disposable income, 2007.
Source: EUROMOD version F6.20.
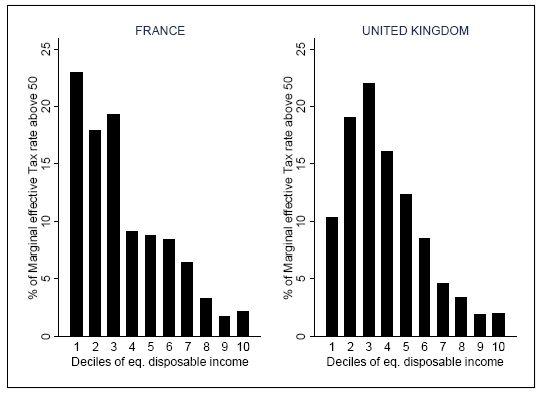

Proportion of high METR by deciles of equivalised disposable income, 2007.
Source: EUROMOD version F6.20.
Patterns similar to those observed in Denmark and Belgium can be identified, among others, in Sweden and Greece and, to a lesser extent, in Finland, Germany and Italy. The concentration of high METR at the top of the income distribution in these countries is mainly driven by the tax component of the METRs.
Within the second scenario, a further distinction can be made between countries in which high METRs are mainly in the very lowest deciles, while their presence is almost negligible in the middle and upper part of the distribution (i.e. Latvia and Estonia as depicted in Figure 11), and countries where the bulk of the high METRs continues to be in the lower deciles of the income distribution, but their presence is decreasingly relevant in the upper deciles (i.e. France and the UK as shown by Figure 12).
A pattern similar to the one shown in Figure 11 can be found, among others, in the three Baltic countries, Spain, Bulgaria and to a lesser extent in Romania; in the majority of the cases the phase out of means-tested benefit explains the pattern. A distribution of high METRs similar to the one reported in Figure 12 can be found, among others, in France, UK, Austria and Cyprus. In these cases, the reasons behind the pattern vary across countries. In the case of France and UK, though, the pattern can be explained by the presence of means-tested benefit at the bottom of the income distribution, by taxes and the phase out of in work benefits in the middle and upper part of it.
The next subsection briefly analyses how average METRs changed between 2007 and 2010. The results shown are relevant in particular for the study of the relationship between inequalities and METRs presented in Section 3.4.
3.3.3 Changes in METRs between 2007 and 2010
In this subsection the changes in average METRs between 2007 and 2010 are analysed for the 27 EU countries. The changes in METRs reported in Figure 13 are the results of two factors: first, they are driven by policy changes that happened between 2007 and 2010; second, 2007 incomes have been uprated using income specific updating factors. In this way, the effects of policy change relative to income growth are captured by the comparisons. For example, in presence of a progressive tax system, the tax component of METRs might increase not only because of an increase in the tax rates following a policy change, but also because of an increase in wages (due to uprating) that might cause a person to pay higher tax rates even in the absence of a change in the tax rates (fiscal drag). As described in Section 2.1, our updating process does not take into account compositional changes and behavioural reactions to policy changes.
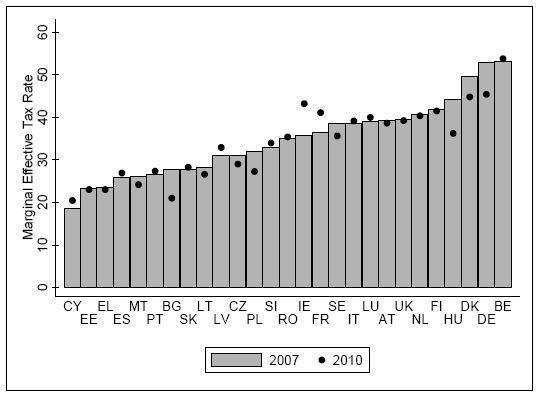
Average METRs in 2007 and 2010 (%).
Note: Countries are ranked by average METR in 2007.
Source: EUROMOD version F6.20.
As shown in Figure 13, changes in the average METRs are observed in many EU countries. In particular, a sizeable increase in the average METRs can be observed in France, where a reform that widened the access to the main social assistance benefits has been implemented, and Ireland, where important reforms have affected the contributions paid both by public sector and private sector employees. Important reductions in METRs can be observed, among others, in Bulgaria, where a flat tax replaces a progressive income tax reducing the tax component of the METRs for the majority of the population, or in Denmark, following the abolition of the middle bracket tax in 2009, a sharp reduction of bottom bracket tax rate in 2009 and 2010 and a gradual increase in tax allowances between 2007 and 2010. Overall, average METRs decrease by more than 1 percentage point in 9 EU Member States, while an increase of similar magnitude is observed in 6 Countries.
3.4 The trade-off between redistribution and work incentives
The analysis presented above described the extent to which different tax-benefit systems in the EU redistribute income and affect work incentives. The aim of this section is to analyse whether a trade-off between redistribution and work incentives is observed across countries in the EU. Are countries with low levels of income inequality characterised by weak work incentives? We use the results from previous sections in order to discuss the relationship between income inequality and work incentives across EU countries.
While the distributional analysis has been conducted for the population as whole, METRs calculations are based on earners in working age only. The choice of focusing on different populations is justified by the fact that tax-benefit systems affect income distribution across the whole population, but they can create incentives and/or disincentives for specific groups (earners in this case). In making the link between redistribution and work incentives we want to keep this specificity and be able to analyse whether countries with low (high) income inequality for the population as a whole are characterised by weaker (stronger) work incentives for those currently in work.
In general, reducing income inequality and providing incentives to work can be considered as two objectives governments need to balance, when designing tax-benefit policies (Adam & Browne, 2010). The relationship between income redistribution and work incentives has been previously analysed, at a national level. For instance, Adam et al. (2006) found a significant negative relation between METRs and Gini coefficients over time in the UK. More generally, the trade-off between equity and efficiency has been widely analysed in the framework of optimal income taxation (see, among others, Mirrlees, 1971; Saez, 2001; Saez, 2002).
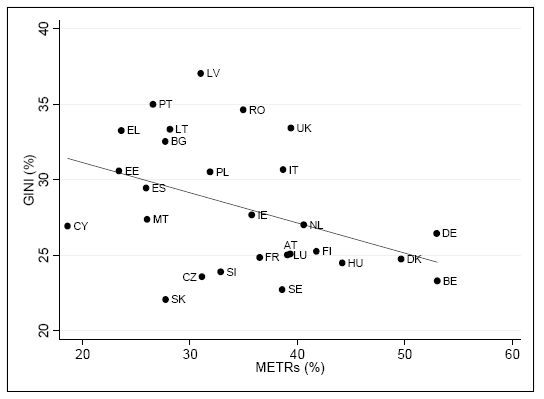
Figure 14 plots Gini coefficients and mean Marginal Effective Tax Rates for EU-27 countries in 2007. The figure shows that countries with high income inequality are usually characterised by strong work incentives. Income inequality is negatively correlated with mean METR, with a correlation of −0.41.

Relationship between income inequality and work incentives (2007).
Source: EUROMOD version F6.20.
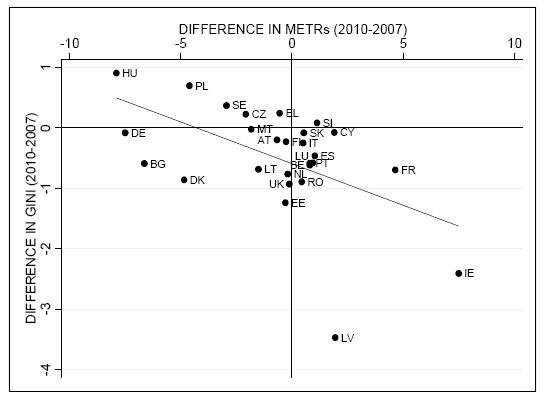
In order to further investigate the relationship across EU countries, we compare changes in income inequality and work incentives across policy years 2007-2010. By abstracting from population changes and behavioural responses we attempt to capture the effect of policy changes on income inequality and work incentives. In particular, our aim is to study whether countries in which policy reforms decrease (increase) income inequality, present higher (lower) mean METR. Such pattern is depicted in Figure 15, where a negative correlation between differences in Gini coefficients and differences in mean METR is observed between 2007 and 2010. The equity-efficiency trade-off seems to describe the situation of most countries in the EU. For instance, in countries such as Hungary, the 2010 tax-benefit system increases income inequality while decreasing mean METR. The opposite is observed for countries such as Ireland, where inequality decreases while work incentives are weakened. It is worth noticing, however, that many countries do not follow this pattern. A decrease in both, inequality and mean METR is observed in Bulgaria and Denmark. Other exceptions are Germany, where work incentives strengthen with no substantial change in inequality; and Estonia and the UK where inequality decreases with no particular changes in work incentives.

Relationship between changes in GINI and changes in mean METR.
Note: Differences in GINI and METRs expressed in percentage points.
Source: EUROMOD version F6.20.
Despite being a mere association, Figures 14 and 15 highlight the existence of a negative relationship between METRs and Gini coefficient, suggesting the presence of a trade-off between work incentives and income inequality.
4. Conclusion
Substantial differences exist in the size and design of tax-benefit systems across European countries, underlying different approaches towards redistribution and towards the role of the welfare state. In this work, we analysed the redistributive impact of tax-benefit systems and the extent to which they influence work incentives across EU Member States. We further studied the trade-off between income redistribution and work incentives faced on the intensive margin of labour supply across the EU, finding a negative relationship both in 2007 levels and in 2007-2010 changes. The analysis made use of EUROMOD, the EU wide tax-benefit microsimulation model, which allows the individual effect of specific types of policies to be identified.
The importance of the redistributive system across EU countries can be partly measured by the relative size of different tax-benefit components. In general, the share of taxes and benefit in disposable income is relatively large in Nordic countries, while less important in Southern and Eastern European countries. Italy and Latvia are notable exceptions with taxes representing an important component and benefits accounting for a small percentage of disposable income. In terms of redistribution, our results show a significant effect of tax-benefit systems in reducing income inequality, although to a different degree across EU countries. Public pensions play a primary role in reducing inequalities arising from original income, while the role of other non-pensions tax-benefit instruments is prevalent among Anglo-Saxon countries, mainly through means-tested benefits. Excluding pensions, the component accounting the most for income redistribution in the majority of countries is income taxes.
Work incentives implied by the tax and benefit systems of Member States were analysed through the calculation of Marginal Effective Tax Rates. Measuring the share of an increase in earnings that would be taxed away because of an increase in the tax liabilities and social insurance contributions or loss of benefit entitlement, METRs are a popular indicator of the incentives faced by a worker on the intensive margin of labour supply. Our analysis showed that METRs are widely different across countries, both with respect to their median and the within country distribution. The increase in tax liabilities is, on average, the most important component of the country specific METRs; however, benefit withdrawal is important at lower incomes in countries that have adopted substantial means-tested programmes. From our analysis it also emerges that the features of the tax and benefit systems influence the within country distribution of high METRs, with a prevalence towards the lower part of the income distribution if high METRs are mainly driven by the loss of means-tested benefits and towards the upper part of the distribution if they are mainly driven by taxation.
Finally, we explored the relation between Gini coefficient and METRs, both in 2007 levels and 2007-2010 variation. Despite some notable exceptions, we identified a negative and significant relationship in both cases, highlighting a trade-off between equity and work incentives across the EU. Future analysis should explore more in detail the trade-off between redistribution and work incentives at the EU level. In particular, it would be interesting to identify the type of policies, which allow achieving both lower income inequality and stronger work incentives, as observed in some countries, according to our results.
The analysis presented portrays the great heterogeneity in tax-benefit systems characterising EU Member States and the differences that it generates in terms of both income distribution and work incentives faced by workers. Determining whether this multitude of tax-benefit designs represents a disadvantage for the political future of the Union goes beyond the descriptive purpose of this paper. However, by stressing these differences, the results provide a starting point for future analysis, in case, a move towards harmonization of tax-benefit systems will come on top of the EU political agenda.
Footnotes
1.
See also Bargain et al. (2012) for comparative evidence on labour supply elasticities in 17 European countries and the US. The study makes use of EUROMOD to enhance cross-country comparability between European countries
2.
See also OECD, 2007.
3.
In most countries, the UDB version of EU-SILC is used. However, for Greece, Spain, Italy, Austria and Slovakia the national version of the EU-SILC is used because it includes more variables at the necessary level of detail. For some other countries, additional national variables are added to UDB SILC.
4.
The policy systems of the 27 EU member states have been modelled in EUROMOD through a tree stage process; as a consequence, 2005 systems are modelled for nine countries; 2006 systems for eighteen; and 2007-2010 system for all the 27 EU countries.
5.
See country specific EUROMOD Country Reports for information about the updating process.
6.
See country specific EUROMOD Country Reports for more information.
7.
Disposable income is equivalised using the “modified OECD” equivalence scale, assigning a weight of 1 to the first adult, 0.5 to each subsequent adult and 0.3 to each child aged below 14.
8.
Together with incentive in increasing the number of hours worked, METRs capture also the incentive in increasing effort (or wage) for the same labour supply.
9.
It should be noted that EUROMOD simulations are usually based on yearly incomes averaged over the 12 months. This could introduce some degree of imprecision in the simulation of some policies affecting METRs if they are related to shorter period income. Social assistance benefits are, for example, typically affected by this limitation.
10.
The choice of 1 unit of national currency of monthly earnings reduces the risk of having “too small” denominators and the risk of our results being driven by rounding factors. Since part of our analysis focuses on a comparison between 2007 and 2010 values of METRs, we imposed that the condition of having average monthly earnings above 1 unit of national currency must be met both with 2007 and 2010 earning values.
11.
Note that EUROMOD offers the advantage of decomposing household disposable income into even more detailed components (see Avram et al. 2012).
12.
Note that the definition of public pensions used here corresponds to the EU-SILC definition of old age benefits, including lump sum payments at retirement age, which could affect the income distribution.
13.
The absence of the benefit withdrawal component in the average METRs decomposition for Greece is due to the lack of a broad social assistance benefit and to the fact that the remaining means tested benefits are implemented using thresholds or brackets. In these cases the extra earnings produce a variation in the benefit received only if those income limits are crossed, generating a sizeable reduction in the benefit amount, or even its loss. The very large values of the METRs following this process, as well as the very small number of cases for whom this happens, make very likely for them to be classified as “outliers” and not included in the analysis.
Appendix
METRs Distribution across the EU, 2007.
| MEAN | MEDIAN | PERCENTILES | ||
|---|---|---|---|---|
| 25% | 75% | |||
| AUSTRIA | 39.3 | 44.6 | 33.7 | 46.9 |
| BELGIUM | 53 | 54.9 | 52.4 | 59.4 |
| BULGARIA | 27.7 | 31.7 | 22 | 31.7 |
| CYPRUS | 18.6 | 20 | 6.3 | 27 |
| CZECK REPUBLIC | 31.1 | 29.1 | 29.1 | 34.4 |
| GERMANY | 53 | 49.6 | 42.7 | 55.3 |
| DENMARK | 49.7 | 48.3 | 43 | 62.3 |
| ESTONIA | 23.4 | 24 | 22.5 | 24 |
| GREECE | 23.6 | 19.6 | 16 | 40.4 |
| SPAIN | 25.9 | 28.8 | 6.3 | 32.6 |
| FINLAND | 41.8 | 44.8 | 34.4 | 49.9 |
| FRANCE | 36.5 | 31.6 | 29.5 | 41.7 |
| HUNGARY | 44.2 | 40 | 35 | 57 |
| IRELAND | 35.7 | 37.6 | 24 | 47 |
| ITALY | 38.7 | 38.4 | 36.5 | 46.9 |
| LITHUANIA | 28.1 | 30 | 30 | 30 |
| LUXEMBOURG | 39.1 | 40.2 | 28.4 | 46.7 |
| LATVIA | 31 | 31.8 | 31.8 | 31.8 |
| MALTA | 26 | 25 | 21 | 35 |
| NETHERLANDS | 40.6 | 44.2 | 34.3 | 51.5 |
| POLAND | 31.9 | 35.2 | 32.9 | 35.2 |
| PORTUGAL | 26.6 | 24 | 11 | 34.5 |
| ROMANIA | 35 | 30.3 | 30.3 | 32.3 |
| SWEDEN | 38.6 | 31.9 | 31.9 | 51.8 |
| SLOVENIA | 32.9 | 32.6 | 27 | 40.7 |
| SLOVAKIA | 27.7 | 29.9 | 28.7 | 29.9 |
| UNITED KINGDOM | 39.4 | 34.4 | 33 | 41.1 |
-
Source: EUROMOD F6.20.
Proportion of METRs above 50% by deciles of equivalised disposable income, 2007.
| N. Obs | Prop. | DECILES | ||||||||||
|---|---|---|---|---|---|---|---|---|---|---|---|---|
| 1 | 2 | 3 | 4 | 5 | 6 | 7 | 8 | 9 | 10 | |||
| AUSTRIA | 575 | 9.3 | 18.0 | 11.6 | 9.3 | 7.1 | 9.4 | 9.2 | 9.8 | 7.7 | 7.9 | 10.1 |
| BELGIUM | 5,136 | 79.2 | 1.4 | 2.3 | 3.7 | 6.3 | 9.1 | 11.0 | 13.4 | 15.4 | 18.1 | 19.4 |
| BULGARIA | 44 | 0.9 | 88.6 | 1.8 | 2.6 | 0.0 | 4.0 | 0.0 | 0.0 | 0.0 | 3.0 | 0.0 |
| CYPRUS | 116 | 2.8 | 12.4 | 16.8 | 24.2 | 12.5 | 9.9 | 6.4 | 3.5 | 6.4 | 1.0 | 6.6 |
| CZECK REPUBLIC | 310 | 2.9 | 56.0 | 13.4 | 4.4 | 2.5 | 2.1 | 3.6 | 10.8 | 5.5 | 0.5 | 1.2 |
| GERMANY | 6,048 | 47.7 | 6.2 | 7.8 | 4.3 | 6.8 | 9.3 | 11.2 | 14.0 | 14.7 | 15.1 | 10.7 |
| DENMARK | 3,136 | 35.9 | 1.2 | 3.2 | 4.4 | 6.3 | 6.4 | 7.7 | 10.2 | 15.0 | 19.7 | 26.0 |
| ESTONIA | 96 | 1.6 | 96.7 | 3.3 | 0.0 | 0.0 | 0.0 | 0.0 | 0.0 | 0.0 | 0.0 | 0.0 |
| GREECE | 67 | 1.0 | 0.0 | 0.0 | 0.0 | 0.0 | 5.2 | 8.1 | 10.4 | 8.3 | 22.6 | 45.5 |
| SPAIN | 300 | 1.7 | 79.0 | 6.2 | 3.6 | 1.7 | 3.4 | 2.9 | 1.0 | 0.3 | 1.1 | 0.9 |
| FINALND | 2,901 | 15.7 | 10.3 | 8.4 | 4.8 | 5.1 | 3.1 | 3.9 | 5.9 | 7.2 | 15.6 | 35.8 |
| FRANCE | 1,321 | 12.2 | 23.0 | 17.9 | 19.3 | 9.1 | 8.8 | 8.4 | 6.4 | 3.3 | 1.7 | 2.1 |
| HUNGARY | 4,068 | 43.0 | 3.8 | 3.6 | 5.3 | 6.4 | 6.4 | 8.0 | 10.5 | 14.0 | 17.8 | 24.1 |
| IRELAND | 711 | 15.6 | 5.2 | 16.9 | 11.2 | 8.2 | 5.8 | 7.1 | 12.1 | 7.4 | 12.6 | 13.5 |
| ITALY | 2,263 | 10.0 | 1.5 | 6.8 | 9.8 | 8.8 | 8.3 | 7.7 | 11.1 | 13.6 | 14.4 | 18.0 |
| LITHUANIA | 31 | 0.6 | 75.6 | 20.7 | 0.0 | 0.8 | 0.0 | 0.0 | 0.0 | 0.0 | 2.9 | 0.0 |
| LXEMBOURG | 459 | 6.8 | 52.5 | 14.6 | 4.0 | 0.3 | 3.3 | 3.8 | 2.4 | 3.6 | 7.9 | 7.8 |
| LATVIA | 110 | 104 | 94.5 | 5.5 | 0.0 | 0.0 | 0.0 | 0.0 | 0.0 | 0.0 | 0.0 | 0.0 |
| MALTA | 115 | 2.9 | 15.5 | 6.1 | 11.6 | 6.5 | 11.2 | 22.0 | 13.3 | 4.5 | 4.0 | 5.2 |
| NETHERLANDS | 3?311 | 26.2 | 7.7 | 8.2 | 10.3 | 10.9 | 8.2 | 7.0 | 7.8 | 7.9 | 9.8 | 22.2 |
| POLAND | 284 | 1.7 | 46.8 | 17.4 | 11.3 | 8.4 | 2.2 | 1.3 | 0.7 | 0.0 | 0.0 | 12.0 |
| PORTUGAL | 197 | 4.0 | 53.2 | 21.5 | 1.3 | 3.2 | 1.7 | 2.9 | 2.8 | 3.6 | 1.6 | 8.4 |
| ROMANIA | 680 | 9.1 | 54.2 | 16.4 | 10.2 | 4.7 | 5.5 | 2.7 | 3.4 | 2.7 | 0.2 | 0.0 |
| SWEDEN | 3?274 | 32.5 | 9.3 | 4.4 | 4.7 | 3.7 | 5.1 | 6.1 | 8.2 | 12.4 | 17.8 | 28.4 |
| SLOVENIA | 2,237 | 14.8 | 13.6 | 4.5 | 2.4 | 2.5 | 1.2 | 3.0 | 2.8 | 7.2 | 20.6 | 42.1 |
| SLOVAKIA | 170 | 2.0 | 64.9 | 11.0 | 6.2 | 2.5 | 3.5 | 5.4 | 3.6 | 0.8 | 2.1 | 0.0 |
| UNITED KINGDOM | 3,860 | 15.8 | 10.3 | 19.0 | 22.0 | 16.1 | 12.3 | 8.5 | 4.6 | 3.4 | 1.9 | 1.9 |
-
Note: The first column on the left reports the total number of observation with METR above 50%; the second column reports the proportion of earners with METR above 50%; the following columns reports the distribution of high METRs across deciles of equivalised disposable income.
-
Source: EUROMOD F6.20.
References
-
1
The poverty trade-off: work incentives and income redistribution in BritainBristol: The Policy Press.
-
2
Redistribution, work incentives and thirty years of UK tax and benefit reform. IFS Working paper 10/24Redistribution, work incentives and thirty years of UK tax and benefit reform. IFS Working paper 10/24.
-
3
Income redistribution in the European Union32nd General Conference of The International Association for Research in Income and Wealth.
-
4
The distributional effects of fiscal consolidation in nine EU countries. EUROMOD Working Paper No. EM2/13The distributional effects of fiscal consolidation in nine EU countries. EUROMOD Working Paper No. EM2/13.
-
5
Handbook of Income Distribution677–789, Redistribution, (Eds.), Handbook of Income Distribution, 1, Chapter 12, Amsterdam, North Holland.
-
6
Comparing Labor Supply Elasticities in Europe and the US: New Results. IZA Discussion Paper 6735Comparing Labor Supply Elasticities in Europe and the US: New Results. IZA Discussion Paper 6735.
-
7
Dimensions of Tax Design: The Mirrlees ReviewMeans-Testing and Tax Rates on Earnings, et al, (Eds.), Dimensions of Tax Design: The Mirrlees Review, Oxford and New York, Oxford University Press.
-
8
Indicators of Unemployment and Low-Wage Traps: Marginal Effective Tax Rates on Employment Incomes. OECD Social, Employment and Migration Working Papers, No. 18Indicators of Unemployment and Low-Wage Traps: Marginal Effective Tax Rates on Employment Incomes. OECD Social, Employment and Migration Working Papers, No. 18.
-
9
Identifying Welfare State Regimes: The Links Between Politics, Instruments and OutcomesGovernance 5:1–26.
-
10
Approximations to the truth: comparing survey and microsimulation approaches to measuring income for social indicatorsSocial Indicators Research 105:387–407.
-
11
The Redistributive Effects of Tax Benefit Systems in the Enlarged EUPublic Finance Review 38:473–500.
-
12
Average and marginal effective tax rates facing workers in the EU. A micro-level analysis of levels, distributions and driving factors. OECD Social, Employment and Migration Working Paper No. 19Paris: OECD.
-
13
Welfare reform in European countries: a microsimulation analysisThe Economic Journal 117:1–44.
-
14
Welfare benefits and work incentives. An analysis of the distribution of net replacement rates in Europe using EUROMOD, a multi-country microsimulation model. EUROMOD Working Paper No. EM4/01Welfare benefits and work incentives. An analysis of the distribution of net replacement rates in Europe using EUROMOD, a multi-country microsimulation model. EUROMOD Working Paper No. EM4/01.
-
15
The Distributional Effects of Government Spending and TaxationHousehold incomes and redistribution in the European Union: quantifying the equalising properties of taxes and benefits, Ed, The Distributional Effects of Government Spending and Taxation, Palgrave.
-
16
Baseline results from the new EU27 EUROMOD (2007–2010). EUROMOD Working Paper No. EM3/13et al, Baseline results from the new EU27 EUROMOD (2007–2010). EUROMOD Working Paper No. EM3/13.
-
17
The Paradox of Redistribution and Strategies for Equality: Welfare State Institutions, Inequality, and Poverty in Western CountriesAmerican Sociological Review 63:661–687.
-
18
On the meaning and measurement of redistribution in cross-country comparisons. Discussion Papers No. 649Statistics Norway, Research Department.
-
19
Fiscal redistribution in the developed countries: New insights from the Luxembourg Income StudySocio-Economic Review 4:482–511.
-
20
Dimensions of Tax Design: The Mirrlees ReviewLabour Supply and Taxes, et al, (Eds.), Dimensions of Tax Design: The Mirrlees Review, Oxford and New York, Oxford University Press.
-
21
An exploration in the theory of optimal income taxationReview of Economic Studies 38:175–208.
- 22
-
23
Tax and Benefit Policies in the Enlarged Europe: Assessing the Impact with Microsimulation ModelsThe effects of taxes and benefits on income distribution in the enlarged EU, (Eds.), Tax and Benefit Policies in the Enlarged Europe: Assessing the Impact with Microsimulation Models, Farnham, Ashgate.
-
24
Using Elasticities to Derive Optimal Income Tax RatesReview of Economic Studies 68:205–229.
-
25
Optimal Income Transfer Programs: Intensive Versus Extensive Labor Supply ResponsesQuarterly Journal of Economics, 117, 1039.
-
26
The Elasticity of Taxable Income with Respect to Marginal Tax Rates: A Critical ReviewJournal of Economic Literature 50:3–50.
-
27
EUROMOD: the EU wide tax-benefit microsimulation modelThe International Journal of Microsimulation 6:4–26.
-
28
The redistributive effect of social transfer programs and taxes: A decomposition across countriesInternational Social Security Review 65:27–48.
Article and author information
Author details
Acknowledgements
The process of extending and updating EUROMOD is financially supported by the Directorate General for Employment, Social Affairs and Equal Opportunities of the European Commission [Progress grant no. VS/2011/0445]. We acknowledge the contribution of all past and current members of the EUROMOD consortium and in particular our colleagues at ISER who worked on the development of the version of EUROMOD used in this paper: Silvia Avram, Paola De Agostini, Francesco Figari, Horacio Levy, Jekaterina Navicke, Alari Paulus, Olga Rastrigina and Iva Tasseva. We would also like to thank Holly Sutherland and an anonymous referee for valuable comments on previous versions of the paper. The usual disclaimer applies. We are grateful for access to microdata from the EU Statistics on Incomes and Living Conditions (EU-SILC) made available by Eurostat under contract EU-SILC/2011/55, the Italian version of the EU-SILC (IT-SILC) made available by ISTAT, the Austrian version of the EU-SILC made available by Statistics Austria, the Lithuanian version of the EU-SILC (PGS) made available by the Lithuanian Department of Statistics, the Slovak version of the EU-SILC made available by the Statistical Office of the Slovak Republic, the Spanish version of the EU-SILC made available by the Spanish Statistical Institute, variables from Bulgarian version of the SILC made available by the National Statistical Institute, variables from the Greek SILC Production Database (PDB) made available by the Greek Statistical Office and the Family Resources Survey (FRS), made available by the UK Department of Work and Pensions (DWP) through the UK Data Archive. Material from the FRS is Crown Copyright and is used with permission. Neither the DWP nor the Data Archive bears any responsibility for the analysis or interpretation of the data reported here. An equivalent disclaimer applies to all other data sources and their respective providers cited in this acknowledgement.
Publication history
- Version of Record published: April 30, 2013 (version 1)
Copyright
© 2013, Jara and Tumino
This article is distributed under the terms of the Creative Commons Attribution License, which permits unrestricted use and redistribution provided that the original author and source are credited.