Modelling the Early life-course (MELC): A Microsimulation Model of Child Development in New Zealand
- Centre of Methods and Policy Application in the Social Sciences, The University of Auckland, New Zealand
- Department of Biostatistics and Epidemiology Auckland University of Technology, New Zealand
Abstract
To understand the factors upon which policies can be devised to improve the lives of children and young people, we have developed a dynamic discrete-time micro-simulation model called ‘Modelling the early life-course’ (MELC). MELC models child development from birth through to age 13, encompassing changes in material and family circumstances, family functioning and early education. MELC focusses on three main outcomes: health service use, early literacy, and conduct problems. A synthetic base population (n = 10,000) derived from the 2006 New Zealand Census is used, and transitions through the life-course are determined from estimates derived by analysing three New Zealand child cohort studies: the Christchurch Health and Development Study, the Dunedin Multidisciplinary Health and Development Study, and the Pacific Islands Families Study. The model has been validated against New Zealand norms for reading, general practitioner visits and hospital admissions. Three scenarios were demonstrated. First, we tested the impact of a number of putatively important factors on early literacy, and found small effects. Second, we found that halving the prevalence of single parenting reduced the prevalence of conduct problems. Third, we changed a number of material and family factors for Māori, Pacific and low-socio-economic groups to be equal to those for the general population, and found that this produced small improvements in reading, but large reductions in conduct problems for these groups. MELC has been deployed as a user friendly desktop application at a number of New Zealand government agencies, where it can be used to test policy-relevant scenarios.
1. Introduction
To understand the factors upon which policies can be devised to improve the lives of children and young people, we have developed a dynamic discrete-time micro-simulation model (MSM) called ‘Modelling the early life-course’ (MELC). MELC models early child development in New Zealand, with a focus on three outcomes: health service use, reading, and conduct problems. These factors were chosen for several reasons. First, each is important for later adult functioning: health service use in childhood – especially some hospitalizations – can portend poorer health in adulthood (Burgner et al., 2015); a one standard deviation increase in childhood reading scores have been estimated to result in 8–20% increase in lifetime earnings (Ludwig & Phillips, 2007); and early conduct problems often lead to compromised physical health, mental health, justice and social outcomes in adulthood (Odgers et al., 2007).
Second, there are well-established risk factors for these outcomes. Among pre- and perinatal factors, smoking in pregnancy has been associated with hospitalizations for asthma (Davidson et al., 2010), as well as later reading (Anthopolos et al., 2013), and conduct problems (Hill, 2002; Gaysina et al., 2013). Low birth weight has also been associated with poorer reading (Chatterji et al., 2014), greater prevalence of conduct problems (Stevenson et al., 1999) and more hospital admissions (Menezes et al., 2010). Young maternal age has been associated with lower reading levels in children (Torres et al., 2015), increased conduct problems (Reijneveld et al., 2012), and hospitalizations for asthma (Davidson et al., 2010), while low levels of maternal education have been associated with lower reading levels (Williams et al., 2013), increased conduct problems (Reijneveld et al., 2012), and increased hospitalizations (Victora et al., 1992). Breastfeeding is known to be beneficial for reading (McCrory & Layte, 2011), and avoiding hospitalization (Ajetunmobi et al., 2015), and behavioural problems (Lind et al., 2014).
Other psycho-social and family factors have also been shown to be important risk factors for these three outcomes. These include childhood maltreatment (reading: Coohey et al., 2011; conduct problems: Wilson et al., 2009; Mackenbach et al., 2014; and hospitalization: Farst et al., 2013), single parenting (reading: Hampden-Thompson, 2013; conduct problems: Murray and Farrington, 2010; and hospitalizations for asthma: Davidson et al., 2010), housing tenure (reading: Haurin et al., 2002; and conduct problems: Boyle, 2002), early childhood education (reading: Dearing et al., 2009; Wylie & Thompson, 2003; conduct problems: Coté et al., 2007), maternal expressed emotion (conduct problems only: Caspi et al., 2004); and harsh parenting (conduct problems only: Mackenbach et al., 2014).
Third, local data (from child cohort studies) are available to simulate these outcomes as a function of the established risk factors. To this end MELC applies simulations – based on a set of stochastic rules derived by analysing longitudinal data – to a synthetic population of new-born children representative of New Zealand births in 2006. These simulations create synthetic histories for these children from birth to age 13, with a wide range of child and family characteristics that may influence the three outcomes updated annually (age 2, 3, 4, etc.).
Like most MSMs, MELC relies on data from the real world to create an artificial one that mimics the original but upon which virtual experiments can be carried out (Gilbert & Troitzsch 2005). Modifications of influential factors can be undertaken to test hypothetical ‘what if’ scenarios on key down-stream outcomes of interest. Aggregation across children can then reveal the effects of these modifications on the MELC population.
However, unlike many MSMs (e.g., APPSIM, Harding 2007; MIDAS, Dekkers et al., 2012; FPOP, Rogers et al., 2014) MELC does not model population growth and demographic change. Instead, MELC models the same group (cohort) of individuals from birth to age 13 and assesses the type of factors that could be modified to improve child outcomes. In this sense MELC is a closed system, i.e., individuals do not leave the model via migration and death nor do individuals enter via immigration and births.
The purpose of the MELC model is to act as a decision-support tool for policy makers, e.g., to test the impact of a potential policy intervention or to investigate the factors most likely to have a large effect on an outcome (Milne et al., 2014). Policy analysts from New Zealand government ministries have been involved in the development of the model. In particular, the policy analysts wanted MELC to be able to be used to determine all the factors that are important for child outcomes, whether or not these factors could be targets for policy interventions. As such, all factors within the model are able to be changed; not just those considered to be obvious targets for policy intervention. In this sense MELC can be used both to test potential policy interventions but also to assess more exploratory “what if?” scenarios.
In this paper we will describe the MELC model, and will exemplify the model by simulating the following three questions posed by the policy analysts
How can we improve early literacy?
How does single parenting affect later conduct problems?
What interventions have impact on later outcomes (health, social, education, justice) for Maori (the indigenous people), Pacific or low-socio-economic status groups?
Cognizant that the answers to these policy questions will necessarily be limited to factors included in the MELC model, we have designed MELC to model a range of biological, social and psychological factors, as described in the sections that follow.
2. Methods
The two main components required for the MELC model to function are: (i) a sample of children to use as the starting population; and (ii) a series of transition equations that determine the characteristics children (and their families) acquire as they age.
2.1 Sample
For our starting population, we created a synthetic birth cohort of children by analysing data from 10,000 randomly selected children aged 0 and their families from the 2006 New Zealand Census. This is described in more detail elsewhere (Statistics New Zealand, 2014a). Briefly, each child was matched with the two children most similar to them to form a sample of ‘clusters’, each containing three children. A synthetic cohort was then derived by forming a ‘composite’ child from each cluster, with each characteristic for each composite child randomly chosen from the characteristics of the three children in the cluster. The resulting cohort (n = 10,000) was found to be representative of New Zealand births in 2006, and checks were undertaken to ensure that data from the cohort could not be used to reveal confidential information about any ‘actual’ 0-year old child from the 2006 Census (Statistics New Zealand, 2014a).
This cohort was augmented with birth characteristics not available in the 2006 Census (smoking in pregnancy, drinking in pregnancy, birth weight, gestational age, breastfeeding [months]), by matching each synthetic child with the two children most similar to them from three New Zealand longitudinal birth cohorts (described in more detail below): the Christchurch Health and Development Study (CHDS, Fergusson & Horwood, 2001), the Dunedin Multidisciplinary Health and Development Study (DMHDS, Silva and Stanton, 1996), Pacific Islands Families Study (PIFS, Paterson et al., 2008). Birth characteristic were then assigned to each synthetic child by randomly selecting from the characteristics of the two closest matches in the birth cohorts.
In all, the sample contained data from birth and the first year of life, and these characteristics served as the starting point for the micro-simulation. Characteristics at all subsequent years (from ages 2–13) were modelled at yearly steps using micro-simulation as described below.
2.2 Transition equations
The following steps were undertaken to develop the transition equations:
2.2.1 Conceptual framework
The conceptual framework comprises a series of interconnected pathways, following a framework based on the social determinants of health (Solar & Irwin 2010) where structural elements related to social disadvantage fundamentally determine intermediate parental and family factors and final outcomes. In the framework developed for MELC, characteristics at birth (including perinatal characteristics) determine family characteristics and employment that vary year by year. Both of these determine psychosocial and housing factors that vary year by year, while all three determine outcomes (health service use, reading and conduct problems) that vary year by year (see Figure 1).
2.2.2 Modelling associations
We statistically derived parameters for each path in the conceptual framework by analysing longitudinal data from the three longitudinal birth cohorts listed above. These studies cover different timeframes and populations. The CHDS cohort (n = 1265) was born in 1977 in Christchurch, on New Zealand’s South Island, and is largely New Zealand European (white) with populations of Māori and Pacific children under-represented. Data have been collected up to age 30. The DMHDS cohort (n = 1037) was born in 1972/73 in Dunedin, on New Zealand’s South Island, and is also largely New Zealand European with populations of Māori and Pacific children under-represented. Data have been collected up to age 38. The PIFS cohort (n = 1398) was born in 2000 in South Auckland, on New Zealand’s North Island, and is a cohort of children of Pacific descent. Data have been collected up to age 11.
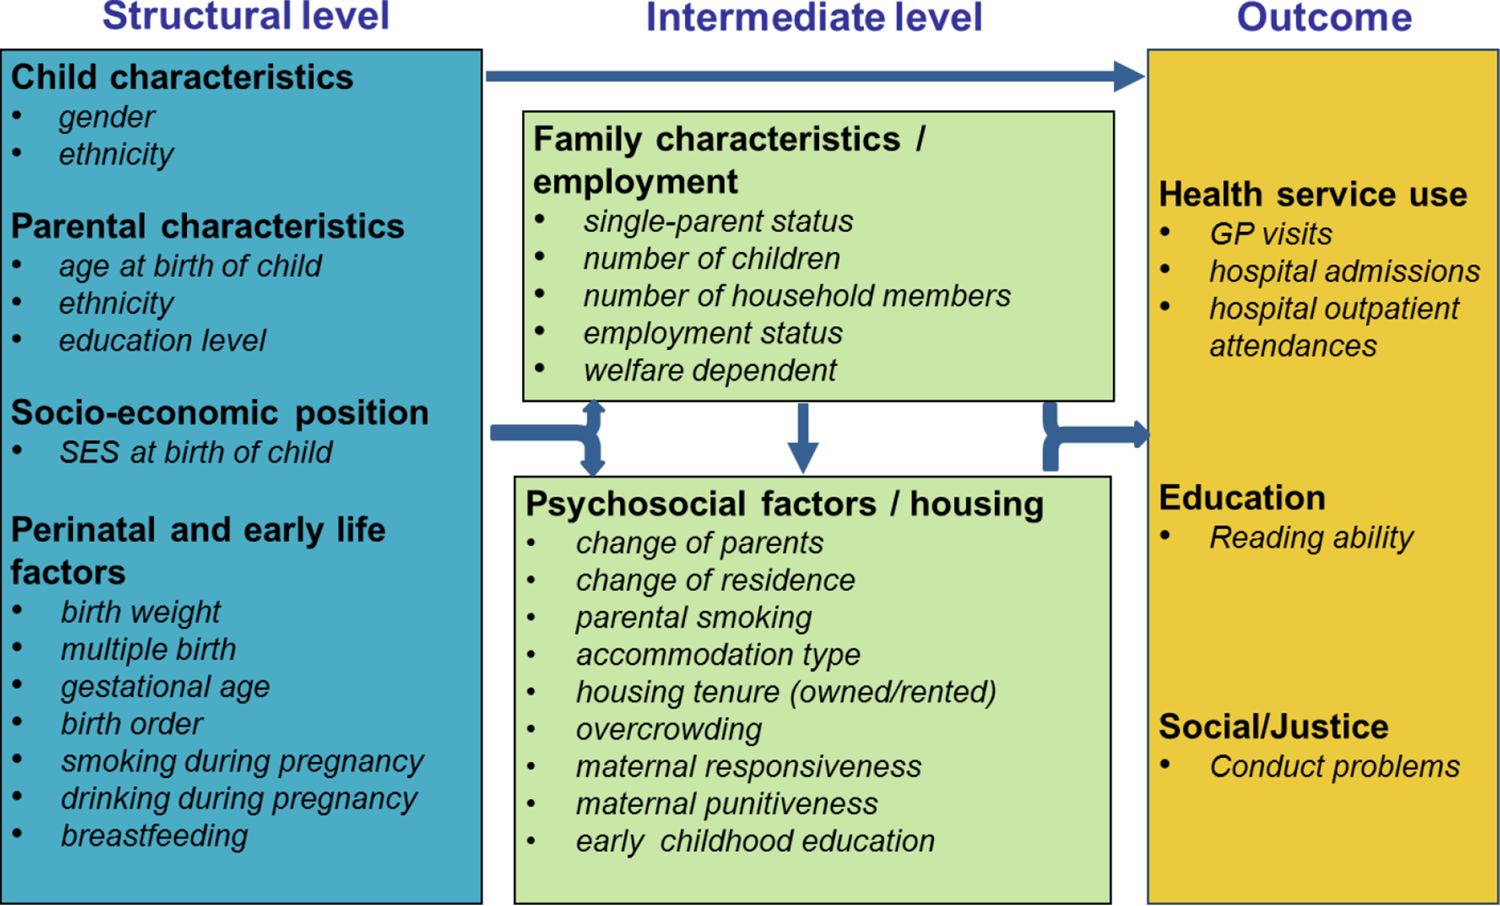
Conceptual model of the early life course.
Analysing combined data. The three datasets were stacked together to form a single dataset with n = 3700 cases, and this dataset was used to estimates parameters for MELC. The rationale for combining the studies was to get more representative estimates for the simulation model. The extent to which this was achieved can never be known for certain, but perhaps can be inferred by the extent to which the simulation model produces results that are similar to those of the New Zealand population. This is tested in the validation Section (2.4) below.
All factors were modelled, except factors from birth and the first year of life (i.e., characteristics of the starting population). Different types of regression models were undertaken depending on the distribution of the outcome factor modelled. For binary outcomes (e.g., single parent family, housing tenure [owned/rented], conduct problems) logistic regression models were computed; for continuous outcomes (e.g., reading scores), least-squares regression models were computed; and for count models (e.g., number of GP visits, number of outpatient attendances), Poisson or negative binomial models were computed. The distribution of some outcomes required modelling that was more involved. For example, for hours worked per week by the mother and father there was a large peak at zero indicating the mother or father was not in the workforce, and then a relative normal distribution (with a peak around 40 hours) for mothers and fathers in the workforce. This was modelled in a two-step process whereby the chance of being in the workforce was first modelled using logistic regression. Then, for those in the workforce the number of hours worked was modelled using a least-squares regression.
The set of predictors for each outcome were chosen using a stepwise procedure in SAS 9.3 (SAS Institute Inc, 2010). Potential predictors for each ‘outcome’ factor included all factors considered to be on the pathway of the outcome, as represented by the conceptual framework, including potential two-way interactions with age and ethnicity, and quadratic terms for continuous factors. In addition, lagged dependent variables (i.e., the value of an outcome for a previous year) were generally included as predictors for count and continuous outcomes outcomes – this approach was found to outperform other methods in producing simulated data that best matched the original (McLay et al., 2015). Stepwise (forward and backward) selection were initially used, with a p < 0.2 criterion for the addition of terms and a p < 0.25 criterion for the removal of terms. Then, backward selection with a p < .05 criterion was used to remove terms so that only terms significant at p < .05 remained in the final model. Interaction and quadratic terms were treated ‘hierarchically’ such that non-significant main effects remained in the model in the presence of significant interactions. A list of the terms in each model is shown in the web appendix, and shows the extent to which each term has direct effects on outcomes, and sometimes indirect effects on outcomes (i.e., through other factors).
We compared the factors in the MELC statistical models to those in the literature for factors in the scenarios tested. In general, the direction of associations in MELC models matched those in the literature; the only difference was that for the association between maternal age and conduct problems, the MELC statistical models included different age effects by ethnicity: for Māori and European children younger maternal age was associated with increased conduct problems (matching the literature, e.g., Reijneveld et al., 2012), whereas for Pacific children younger maternal age was associated with decreased conduct problems. However, some factors that were found to be important in the literature were absent in the MELC statistical models. For example, associations between reading and smoking in pregnancy have been reported in the literature (Anthopolos et al., 2013), but did not meet threshold for inclusion in the MELC reading model; associations between conduct problems and smoking in pregnancy and maternal expressed emotion have been reported in the literature (Gaysina et al., 2013; Caspi et al., 2004), but these factors did not meet threshold for inclusion in the MELC conduct problems model; and associations between hospital admissions and smoking in pregnancy, maternal education, maternal age, and single parenting have been reported in the literature (Menezes et al., 2010; Victora et al., 1992; Davidson et al., 2010; Ajetunmobi et al., 2015), but these factors did not meet threshold for inclusion in the MELC hospital admissions model. These omissions should be considered when interpreting results from the model.
Weighting
Weights were used in analyses to adequately represent all ethnic groups. First, weights were applied to the combined sample to represent the ethnic distribution of New Zealand children in 2006: 58% New Zealanders of European descent, 24% Māori (the indigenous population), 9% Pacific People (e.g., Samoan, Tongan, Cook Island Māori), 9% Asian (e.g., Indian, Chinese). Weights applied were 1.04, 2.96, 0.26, and 31.99 for European, Māori, Pacific and Asian, respectively, to account for the fact that European, Māori, and Asian children were under-represented in the sample and Pacific children over-represented.
Further, the Māori in the combined sample largely comprise Māori from the CHDS and DMHDS cohorts from New Zealand’s South Island, which raises concerns about the representativeness of this group given the majority (87%) of New Zealand Māori live in the North Island (Statistics New Zealand, 2014b). To test this, we used Māori cultural affiliation (the extent to which individuals speak and understand the Māori language and are actively involved in Māori cultural activities) as an indicator of representativeness to compare Māori in the CHDS and DMHDS cohorts with a representative national sample of New Zealand Māori children, the Te Hoe Nuku Roa sample (THNR, Fitzgerald & Durie, 2000). Note that we could not assess the representativeness of Māori in the PIFS sample as Māori cultural affiliation was not assessed in the PIFS sample.
Cultural affiliation was taken as the first principal component drawn from scores in the combined three cohorts (CHDS, DMHDS, THNR) on five items:
Marae (Māori communal meeting house) attendance, coded 0 = never, 1 = once or twice in lifetime, 2 = once or twice in past year, 3 = most months, 4 = most weeks, 5 = most days);
Tangi (Māori funeral) attendance, coded 0 = no, 1 = yes;
Involvement in Māori cultural groups and activities, coded 0 = no; 1 = yes;
Māori language communication, coded 0 = know no Māori language at all; 1 = know a few words and greetings; 2 = have an understanding of Māori language at a very basic level; 3 = have an understanding of Māori language at an intermediate level; 4 = have a confident understanding of Māori language in most situations; 5 = fluent speaker learnt as second language 6 = fluent speaker learnt as first language;
Listening to Māori language radio or watching Māori language television, coded 0 = never; 1 = very rarely; 2 = yearly; 3 = monthly; 4 = weekly; 5 = daily.
Quintiles of cultural affiliation were then derived using cut-offs based on the THNR cohort only.
The proportion of Māori (combined across the CHDS and DMHDS cohorts) in each of these quintiles, relative to the 20% of THNR in each quintile, was then used to weight Māori to represent the cultural affiliation distribution of the representative cohort. This is described in Table 1. The table shows that the cultural affiliation of Māori combined across the CHDS and DMHDS cohorts was skewed towards the lower end of the distribution of the THNR sample. As such, those in the lowest cultural affiliation quintiles were given a lower weight and those in all other cultural affiliation quintiles were given a higher weight. The weights were then iteratively adjusted in combination with the ethnicity weights (to ensure the correct proportion of ethnicities and of Māori in cultural affiliation quintiles) to give the final cultural affiliation weights shown in the right-most column of Table 1.
Weighting based on cultural affiliation.
| Quintiles | THNR Māori (%) | CHDS/DMHDS Māori (%) | CHDS/DMHDS Māori | Final cultural affiliation weight |
|---|---|---|---|---|
| 1 – low | 20 | 57.9 | 20/57.9 = 0.35 | 0.34 |
| 2 | 20 | 19.1 | 20/19.1 = 1.05 | 1.08 |
| 3 | 20 | 7.9 | 20/7.9 = 2.53 | 2.65 |
| 4 | 20 | 10.0 | 20/10.0 = 2.00 | 2.03 |
| 5 – high | 20 | 5.1 | 20/5.1 = 3.92 | 4.15 |
Weights for ethnicity and Māori cultural affiliation were multiplied together with iterative adjustments (to ensure the correct proportions for both ethnicity and cultural affiliation were achieved when the weights were applied to the sample) to give an overall weight for each participant in analyses (see Table 2). To negate the impact of the large weight (31.99) attached to those of Asian ethnicity in the combined sample, Asian and European categories were combined in analyses.
Final weights used in analysis.
| Ethnicity | Ethnicity weight | Māori cultural affiliation quintile | Māori cultural affiliation weight | Final weight |
|---|---|---|---|---|
| European | 1.04 | 1 | 1.04 | |
| Māori | 2.96 | 1 | 2.96a | |
| 2.96 | Quintile 1 | 0.34 | 1.02 | |
| 2.96 | Quintile 2 | 1.08 | 3.20 | |
| 2.96 | Quintile 3 | 2.65 | 7.84 | |
| 2.96 | Quintile 4 | 2.03 | 6.02 | |
| 2.96 | Quintile 5 | 4.15 | 12.28 | |
| Pacific | 0.26 | 1 | 0.26 | |
| Asian | 31.99 | 1 | 31.99 |
-
a
This weight was applied to Māori in the PIFS sample, for whom Māori cultural affiliation could not be assessed
Imputing missing data
To enable modelling with maximal data, imputation of missing data was undertaken prior to modelling, following the methods adopted by the Social Genome Project (Winship & Owen, 2013). The CHDS was used as the base for the conceptual framework for the initial MELC model (Lay-Yee et al., 2015) and as such contains all the variables for all the years that need to be modelled. Thus, the only imputation that was needed for the CHDS data was to complete missing cases for some variables. This was achieved by first ordering variables from least missing to most missing. The variable with the least missing values was then regressed against all variables with no missing values (n = 11), and missing values were then stochastically – and singly – imputed based on the model estimates. Then, the variable with the next least missing values was regressed against all complete variables (now n = 12), and missing values were imputed in the same way. This process was continued until all variables were complete. Regression models were chosen based on the distribution of the outcome variable: ordinary least-squares regression was used for continuous outcomes; logistic regression used for binary outcomes; multinomial logistic regression used for categorical outcomes; and Poisson or negative binomial regression used for count outcomes.
The DMHDS had data only at some ages (0, 3, 5, 7, 9, 11, 13) and for some of the variables, so imputation was more involved. No imputation was undertaken for ages at which the DMHDS sample was not assessed (e.g., ages 1, 2, 4, 6, 8, 10). For variables that existed at some or all assessment ages, missing values were imputed in the way described above. For variables with missing ages (i.e., missing from ages 0, 3, 5, 7, 9, 11, or 13), imputation was undertaken in one of three ways.
First, logic and stochastic methods were used to impute ‘number of children’, which was missing at ages 0, 5 and 9. For example, if the number of children was the same at ages either side of a missing age – say, age 3 and 7 – then the number of children was assumed to be the same at the missing age. If the number of children was different at ages either side of a missing age then the number of children in the missing age was stochastically assigned with probabilities for values between (and including) the values at the measured ages determined on the basis of distributions from the CHDS sample. For example, if the number of children at age 3 was 2 and at age 7 was 4, then the number of children at age 5 was imputed by randomly choosing from the values {2,3,4}, with the probability of choosing each value determined by the proportion with values {2,3,4} among the CHDS sub-sample for whom the number of children at age 3 was 2 and at age 7 was 4.
Second, variables with sufficiently few missing ages to enable the detection of time-trends were modelled and imputed using DMHDS data only. These included mother’s hours worked (missing at ages 0 & 13), change in residence (missing at age 13), and hospital admissions (missing at ages 3 and 11). Models used automatic variable selection of available predictors (using a 0.05 cutoff for logistic models and improved AIC for linear models) to get predictive values for these variables, and imputed values were stochastically chosen from a distribution with the predicted value as its mean.
Third, variables with a large number of missing ages were modelled and imputed using CHDS data. These included outpatient visits (missing at ages 7 and 9), accommodation type (missing at ages 0, 5, 7, 9, 11, 13), home ownership (missing at ages 0, 5, 7, 9, 11, 13), change in parents (missing at ages 0, 3, 5, 7, 9 and 13), mother’s smoking (missing at ages 3, 5, 7, 13), father’s smoking (missing at ages 0, 3, 5, 7, 13), and general practitioner visits (missing at ages 0, 3, 5, 11, 13). As before, models used automatic variable selection of available predictors to get predictive values for these variables, and imputed values were stochastically chosen from a distribution with the predicted value as its mean.
Variables that were completely missing (Alcohol during pregnancy, Welfare, Father’s hours worked, Over-crowding, GP morbidity visits, GP respiratory visits) were imputed using models based on CHDS data, as described above.
Like the DMHDS, the PIFS study only had data at some ages (0, 1, 2, 4, 6, 9) and for some of the variables. A similar procedure as described above for Dunedin was used to impute data for these variables. That is, for variables that existed at some or all assessment ages, missing values were singly imputed in order of number of missing values (i.e., those with the least number of missing values were imputed first and those with the most number of missing values were imputed last). For variables with missing data for some ages (but present data for others) – e.g., mother’s smoking – imputation was based on models using PIFS data only. For remaining variables – breastfeeding, socio-economic status, single parent status, general practitioner preventive and respiratory visits, father’s smoking, household size, household overcrowding, accommodation type, home ownership, single parent status, welfare receipt, changes in residence, reading score, conduct problems, outpatients visits – imputation was based on models using combined CHDS and DMHDS data.
The total amount of missing data is summarised in the web appendix.
2.2.3 Using measures of association in the simulation
The statistically-derived parameters determine the transition equations that drive the simulation process. For this, an expected score (for continuous or count variables) or a probability (for binary variables) is generated for each outcome for each individual at each age based on the statistical models developed for each outcome described above. A random draw is then taken from the appropriate distribution (normal, Poisson, negative binomial, binomial) using the expected score/probability as the mean of the distribution and the appropriate model-estimated parameter as the variance (the residual standard error for the normal distribution, the mean for the Poisson distribution, and the dispersion parameter for the negative binomial distribution; no variance measure is required for the binomial distribution as only 0s and 1s are generated). This random draw constitutes the stochastic value assigned to each individual for each outcome, and will vary from simulation run to simulation run as different random draws are taken. Moreover, the dynamic nature of the micro-simulation is such that the stochastic value assigned for certain characteristics will influence – through the role of these characteristics in other regression equations – other ‘downstream’ characteristics. Thus, stochastically determined values have cascading effects in the simulation, and this contributes to the variation in the results from simulation run to simulation run.
2.3 Deployment
A user-friendly software application to run MELC was programmed in JAVA and R. A JAVA-based programme called JAMSIM (JAva MicroSIMulation, Mannion et al. 2012), developed from the agent-based modelling software, ASCAPE (Parker, 2011), provides graphical user interface (GUI) features to display simulation outputs.
A library in the statistical software, R – called SIMARIO – bundles together functions for running and manipulating the simulation process and producing outputs. These functions perform dynamic simulation, i.e. transform records based on statistical models to make changes over time; generate descriptive statistics from the simulation results at each iteration; perform multiple simulation runs and compute averages across runs; and allow scenario testing through manipulation of variable distributions at different points in the simulation.
Using JAMSIM and SIMARIO for the MELC model, users have the ability to: (i) view factor distributions for ‘base’ scenarios; (ii) change factors in flexible ways, including: (a) changing the proportion of individuals in categories of a discrete variable; (b) changing the values of a continuous variable for individuals; (c) changing a factor at one point in time or at many different points in time; (d) changing one or many factors at a time; and (e) changing factors for the whole population or for population subgroups of interest (e.g., low socio-economic status groups); and (iii) view the results of scenarios and to compare the results of two or more different scenarios, both for the whole population or for population subgroups of interest.
The JAMSIM/SIMARIO application running the MELC model can be deployed in a desktop environment, and is currently deployed with policy users at New Zealand government ministries.
2.4 Validation
A key requirement of MELC is that it represents the world well. Prevalence rates and means of characteristics and conditions generated by the simulation should match those of the population, i.e., the base scenario of the model should produce valid results. For the MELC model we were able to test this by comparing simulated results against results for the New Zealand population. Prevalences of outcomes for the New Zealand population were derived from the following sources. For general practitioner visits and outpatients attendances we used the New Zealand Health Survey (NZHS) 2011–12 (Ministry of Health, 2012), for hospitalisations we used the National Minimum Dataset (NMDS) data for 2006 (National Health Board, 2013) as the numerator and the 2006 New Zealand Census population (Statistics New Zealand, 2012) as the denominator, and for reading we used age norms published in the Burt Word Reading Test Teachers Manual (Gilmore et al., 1976). No external source for prevalence of conduct problems existed to enable validation – New Zealand population estimates on conduct problems often cite the very longitudinal studies analysed for our model (e.g., Ministry of Social Development, 2007, p9).
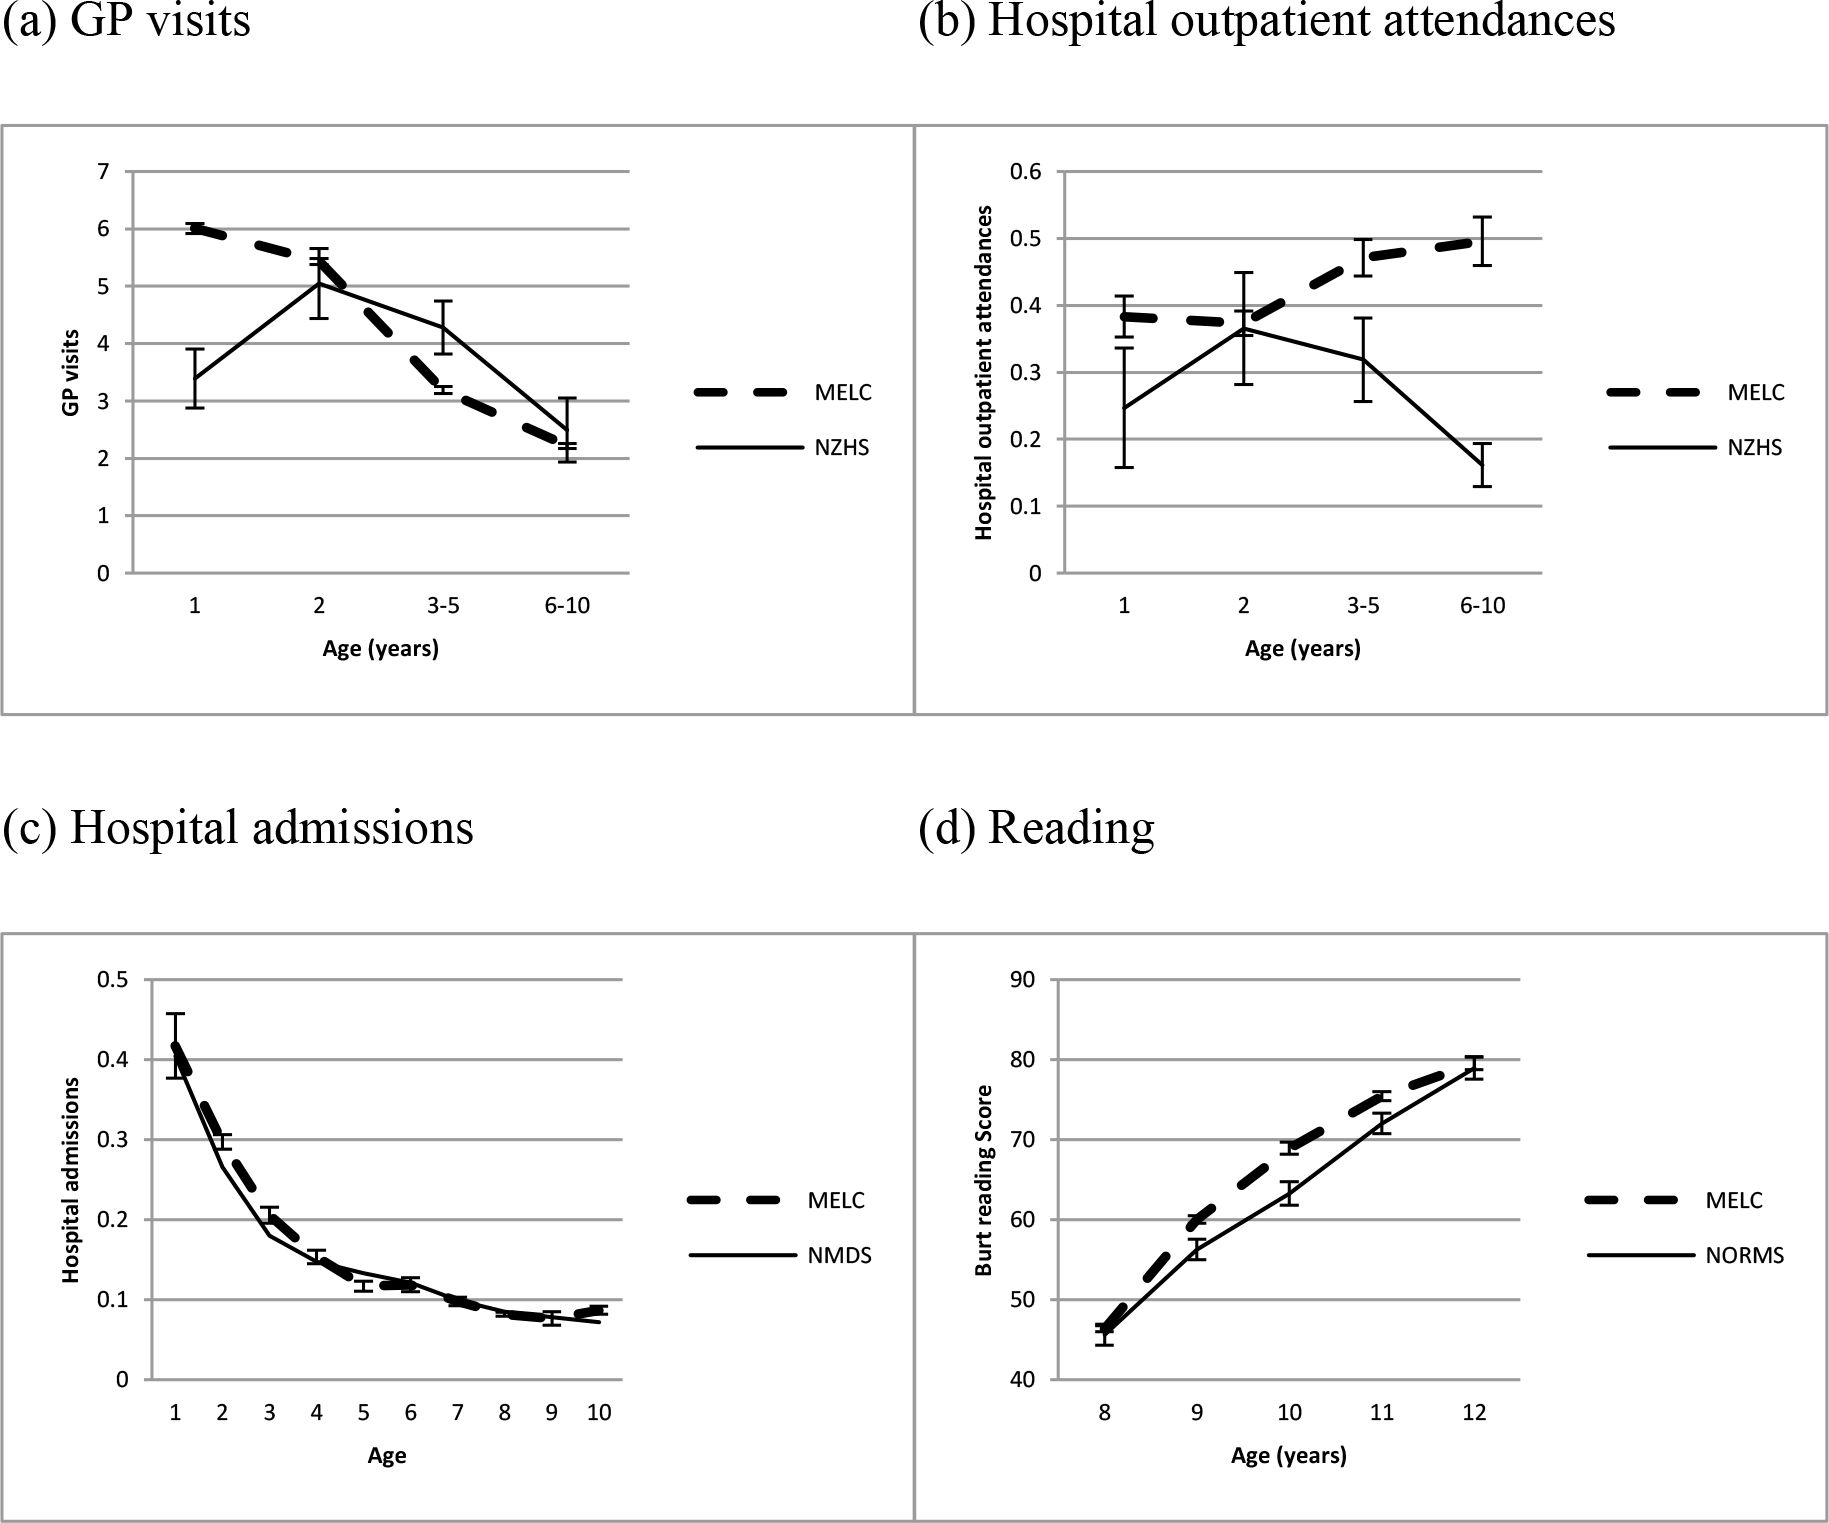
Validation results are shown in Figure 2. Results are shown for NZHS age groupings for GP visits and hospital outpatient attendances (a & b), and for each year of age for hospital admissions and reading (c & d). Note that age = 1 refers to the first year of life, age = 2 refers to the second year of life, etc., not the calendar age of the child.
Panel A of Figure 2 shows that simulated GP visits were close to NZHS estimates for ages 2 and 6–10, but were high for age 1 and low for ages 3–5. Differences in methodology are likely to explain the differences for age 1: the MELC simulation models the number of GP visits in the first year of life whereas the NZHS assesses GP visits in the previous 12 months for a sample of children ages 0–11 months old, so the NZHS does not capture a full year of visits for many of these children. Notably the MELC simulated estimates for year 1 are nearly twice those of the NZHS, consistent with GP visits for NZHS children being substantially undercounted in the second half of the year. The MELC model was amended to bring the GP visits into line for ages 3–5 by adjusting the intercept; this maintains the rank order of all children and also leaves the coefficients of all modifiable factors unchanged, thus performing a similar job as other alignment methods, e.g., sorting methods (Li & O’Donahue, 2014).

Validation of the MELC micro-simulation model for (a) GP visits, (b) Hospital outpatient attendances, (c) Hospital admissions, and (d) Reading. Outcomes are validated against reports from the 2012–13 New Zealand Health Survey (NZHS) (a & b), admissions to all New Zealand hospitals in 2006, as recorded in the National Minimum Dataset (NMDS) (c), and New Zealand norms for the Burt Reading test reported in 1976 (d). Error bars show 95% confidence intervals (no error bars are shown for NMDS hospital admissions as these are based on the whole population).
Panel B of Figure 2 shows that simulated hospital outpatient attendances were accurate only for age 2: simulated estimates were higher than NZHS estimates for all other ages. The higher simulated estimate at age 1 can be explained by the methodological difference described above; the higher estimates at other ages cannot be so easily explained. The MELC model was therefore amended to bring the hospital outpatient attendances into line for ages 3–5 and ages 6–10 by adjusting the intercept and age coefficient (as with GP visits this maintains the rank order of all children but leaves the coefficients of all modifiable factors unchanged).
Panel C of Figure 2 shows that simulated hospital admissions were very close to actual hospital admissions for the New Zealand population, while panel D shows that simulated reading scores were also very close, though were estimated as slightly higher than 1976 New Zealand norms for ages 9, 10 and 11. No amendments were made to the MELC model for either hospital admissions or reading.

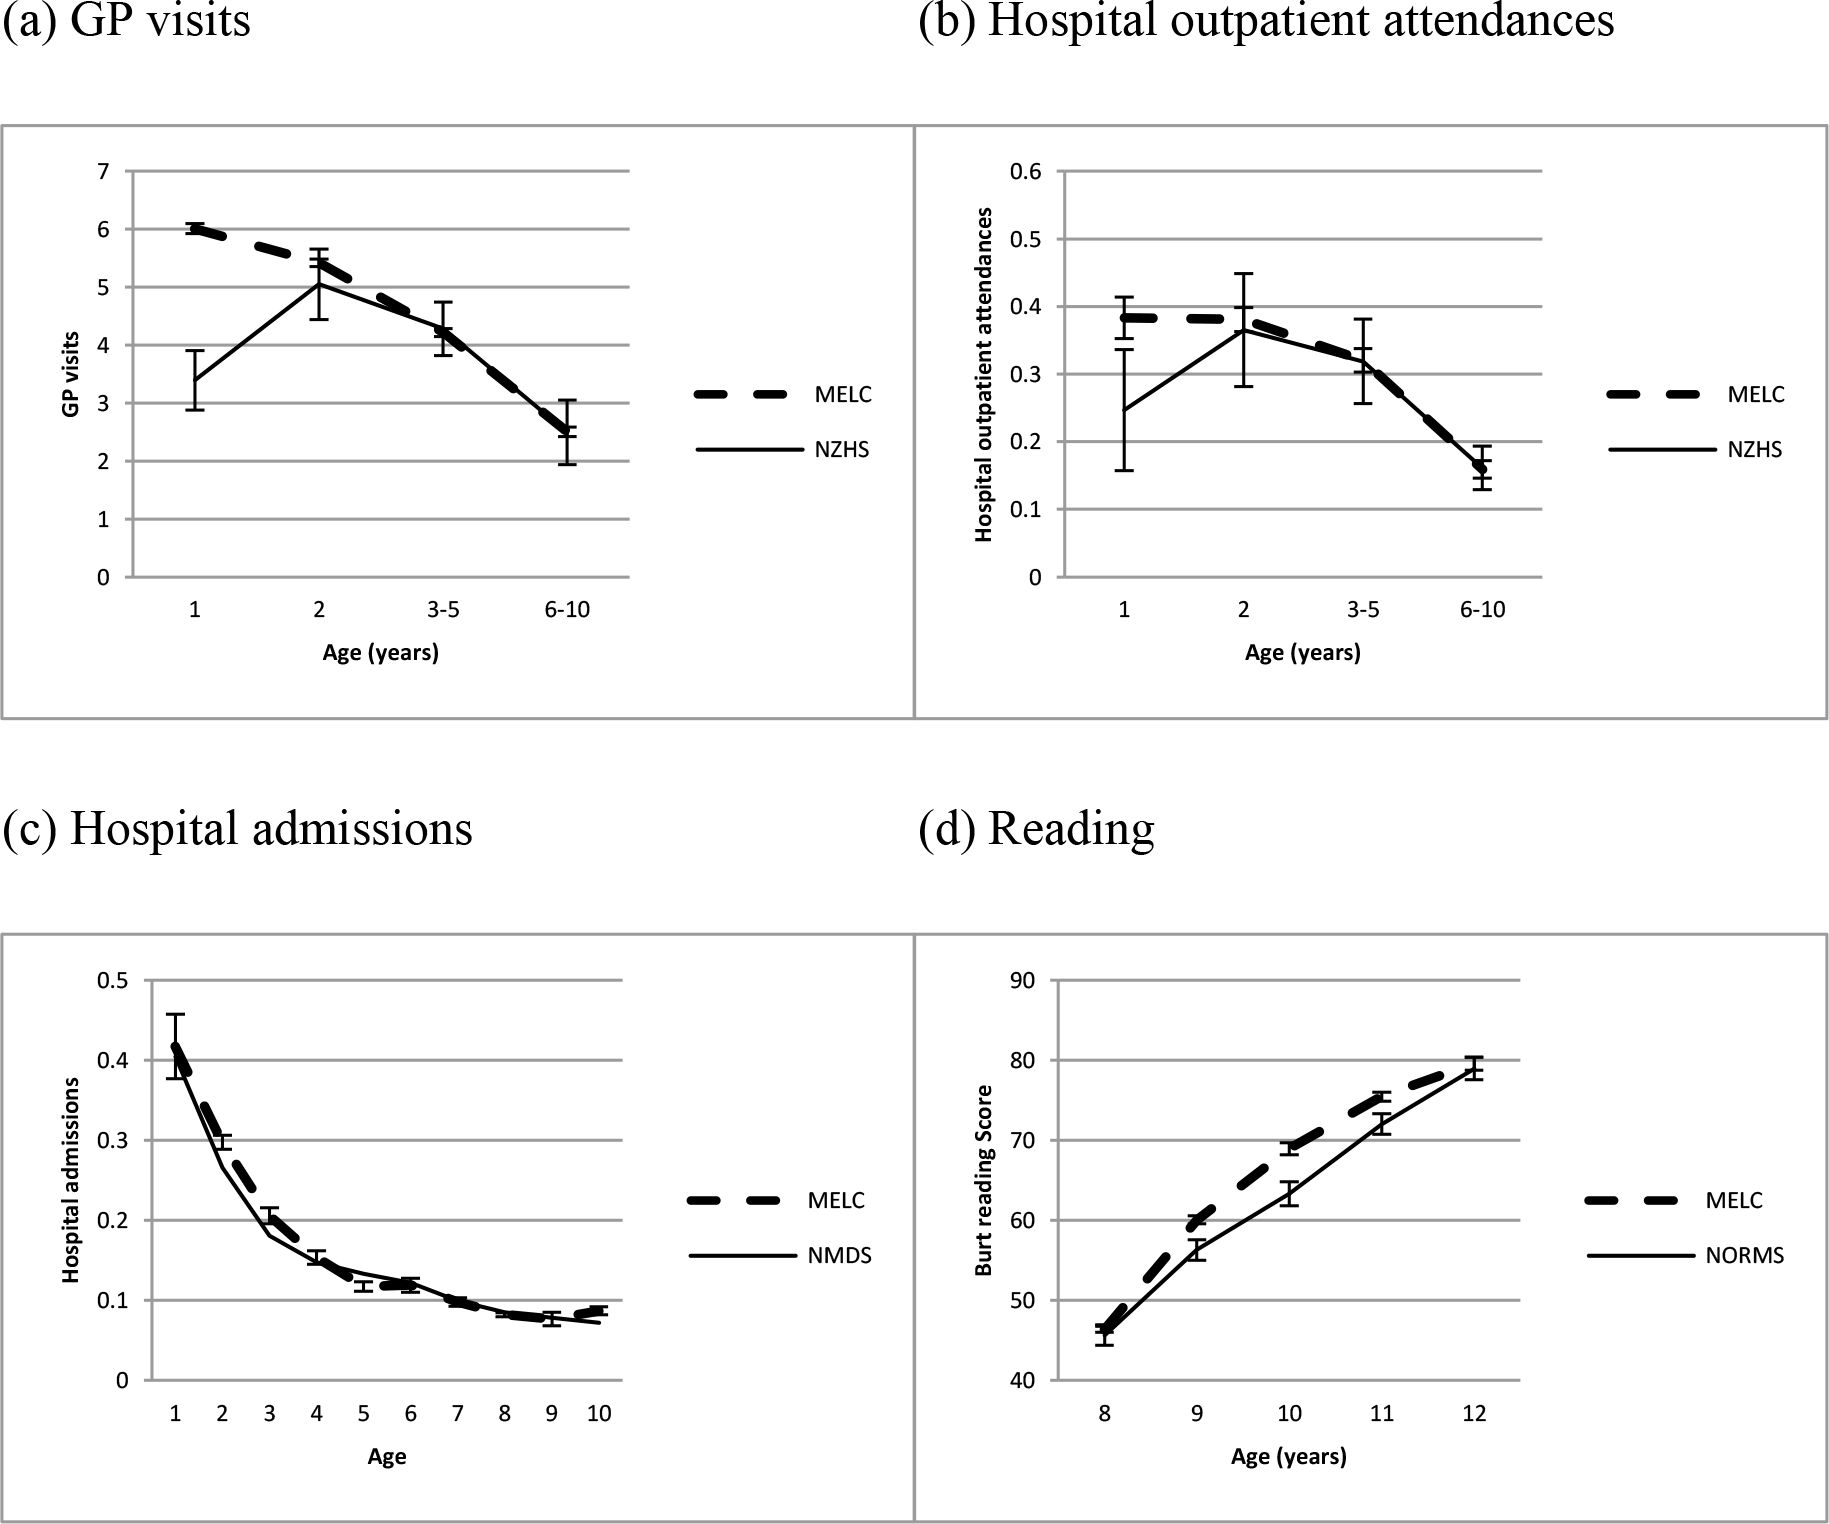
Validation of the MELC micro-simulation model for (a) GP visits, (b) Hospital outpatient attendances, (c) Hospital admissions, and (d) Reading, after adjusting the models for GP visits and Hospital outpatient attendances data. Outcomes are validated against reports from the 2012–13 New Zealand Health Survey (NZHS) (a & b), admissions to all New Zealand hospitals in 2006, as recorded in the National Minimum Dataset (NMDS) (c), and New Zealand norms for the Burt Reading test reported in 1976 (d). Error bars show 95% confidence intervals (no error bars are shown for NMDS hospital admissions as these are based on the whole population).
Comparisons between the MELC simulated outcomes and New Zealand population estimates after adjusting the models for GP visits and hospital outpatient attendances are shown in Figure 3. This shows a close match for all outcomes for all ages, except for age 1 for GP visits and Hospital outpatient attendances, which differ likely because of the methodological differences between the MELC model and the NZHS explained above.
2.5 Testing scenarios
Simulating the starting population using the transition equations produces a virtual cohort with characteristics from birth to age 13. This virtual cohort represents a ‘base’ scenario, i.e., a simulation representing the ‘business as usual’ case. However, of more interest is the ability of MELC to test the effects of ‘policy’ scenarios by changing some features in the system and simulating the effects. We achieved this by changing the distributions of various factors (e.g., changing a proportion of children in welfare-dependent homes; changing the birth weight distribution for children) to mimic the impact of a particular policy intervention under consideration. We chose to change distributions rather than reweight the dataset so that: (i) only downstream variables are affected (weighting affects all variables), thus allowing users to assess the likely effect on any outcome or indeed any other variable in the simulation; (ii) any combination of variables for any subgroup of the population could be changed for a scenario (weighting becomes more complicated the more variables that are changed); and (iii) change is simulated for those most likely to change, via propensity score models described below (weighting implicitly equally weights all those in the target group).
In order to change the distribution of a variable to that desired under a specific scenario, the data values of individual units were changed. This was achieved as follows. For categorical variables, a propensity to be in each category was calculated for each individual, based on a logistic (for two-category variables) or multinomial logistic (for > 2 category variables) model using each individual’s starting or simulated characteristics as predictors. For each simulation run, a random draw from a normal distribution with mean = 0, and standard deviation equal to the standard error of the propensity score was used to determine a constant to be added to (or subtracted from) each individual’s propensity score. This new ‘stochastic’ propensity score was then used to determine which individuals to shift from one group to another (i.e., if the number who need to shift = x, then those with the x highest propensity scores are chosen to shift in each simulation run).
For continuous variables, the process was largely the same in that continuous scores were categorised for scenario testing purposes, and stochastic propensity scores were generated and shifting between categories determined in the way described above. The adjusted categorical values for each individual were converted back to continuous scores by using a series of regression models (either linear regression or negative binomial regression, depending on which gave better fit), each one based on data only from the region defined by the categorisation. Continuous values were assigned by drawing random numbers from the appropriate distribution (normal; negative binomial) using the fitted values from the model as the mean and the variance defined by either the residual standard error (linear model) or the estimated dispersion parameter (negative binomial model).
Micro-simulation of the policy scenario (with factors changed as described above) was then compared to micro-simulation of the ‘base’ scenario to determine the impact of the policy scenario. As each scenario was based on a number of simulation runs, uncertainty in the effect of a policy scenario on an outcome of interest was represented as a confidence interval based on the variation across simulation runs. For the scenarios we present in this paper ten simulation runs were undertaken (as will be shown, these produce relatively narrow confidence intervals).
Three scenarios were tested, and the changes made for each scenario are described below:
How can we improve early literacy?
In the analyses we conducted to model associations, the following four factors were found to be most strongly associated with better reading: older maternal age at birth of child, higher maternal educational qualifications, higher birth weight, and living in an owned home. We varied each of these factors in the whole population to be at or approximating those of high socio-economic status children for maternal age, maternal education and living in an owned home, and to reduce the prevalence of low birth weight (< 2.5kg) by 75%. Specifically, distributions were changed in the following way:
maternal age: < 20 (from 3.9% to 1%), 20–24 (from 14.2% to 10%), 25–29 (from 22.3% to 25%), 30–34 (from 34.7% to 35%), 35–39 (from 20.5% to 25%), 40+ (from 4.4% to 4%); and
maternal education: tertiary (from 23% to 40%), secondary (from 61% to 50%), and none (from 16% to 10%); and
birth weight: <= 2.5kg (from 4.1% to 1%), 2.501–3kg (16.1% to 10%), 3.001–3.5kg (29.6% to 35%), 3.501kg-4kg (34.2% to 35%), > 4kg (16.0% to 19%); and
living in an owned home: from between 48.7% (age 1) and 63.9% (age 13) to 70% (age 1), increasing 1% per year to 82% in year 13.
How does single parenting affect later conduct problems?
Single parenting rates varied from 20.5% in the second year of life to 23.4% in year 13. We reduced single parenting to a flat rate of 10% in each year (roughly half the actual prevalence, and roughly equal to the prevalence among high socio-economic status families), and then tested the overall effect on conduct problems in the population. We note that single parenting is a well-established predictor of child conduct problems (Murray & Farrington, 2010), though its association may be complicated (Jaffee et al., 2003). Nonetheless, this was the scenario of interest to the policy-makers, and the nature of our micro-simulation model allows the manipulation of single-parenting independent of other related explanatory variables (e.g., socio-economic status), thus giving us greater confidence in assessing the likely effect of such a manipulation.
What interventions have impact on later outcomes for Māori, Pacific or low-socioeconomic status groups?
For this scenario we tested an ‘equalization’ scenario in which we altered proportions and means among Māori, Pacific and low-socio-economic status groups to be equal to those for the general population for the following factors: smoking in pregnancy; maternal education; maternal age; breastfeeding; birthweight; single parenting; accommodation type; housing tenure; early childhood education; maternal expressed emotion; and maternal punitiveness. We then tested the effect of these changes on three outcomes: reading, conduct problems, and hospital admissions.
3. Results of testing policy scenarios
3.1 Improving early literacy
In this scenario, we changed a number of factors thought to be important for early literacy, and simulated the results on children’s reading scores. The results show that the scenario resulted in very small but detectable changes to reading scores (see Figure 4).

Impact of scenario to improve early literacy, as measured by the burt reading score.
3.2 The effect of single parenting on conduct problems
The impact on conduct problems of reducing the prevalence of single parenting to 10% for each year of age is shown in Figure 5. The figure shows that reducing the prevalence of single parenting resulted in reductions in the prevalence of conduct problems over time, up to 15–20% by ages 10–13.
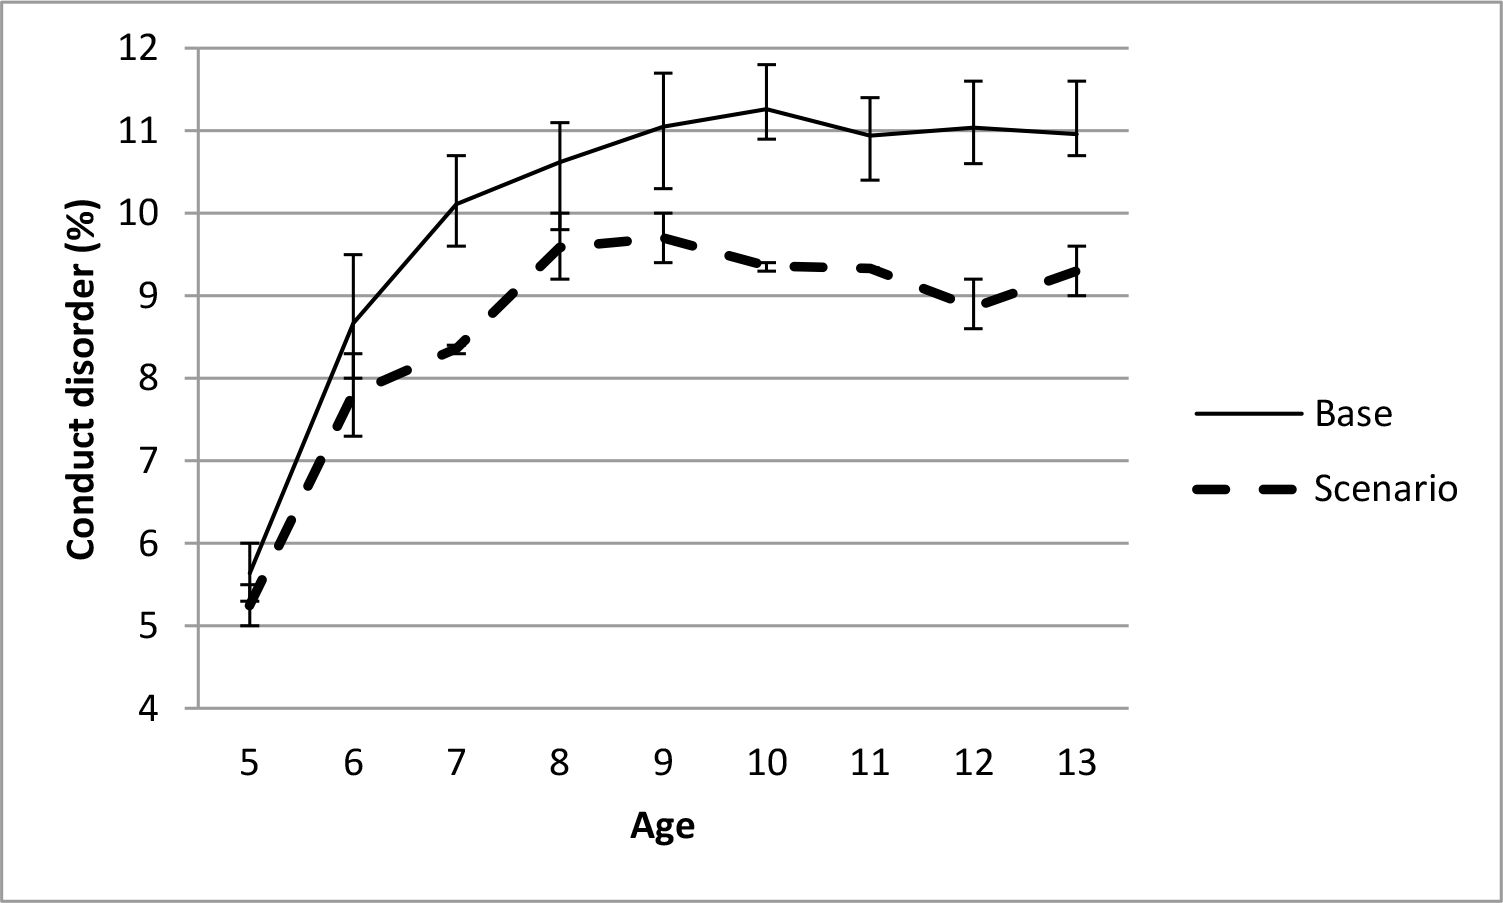

Impact of reducing single parenting on conduct problems.
3.3 Impact on outcomes for Māori, Pacific or low-socio-economic status groups
The impact on conduct problems, reading, and hospital admissions of bringing a number of structural, perinatal and parenting factors (described in the methods section) for Māori, Pacific and low socio-economic status children into line with the general population (‘equalization’ scenario) is shown in Figures 6-8. Figure 6 shows that, for Māori, Pacific and low socio-economic status children, the equalization scenario produced a reduction in conduct problems of about four percentage points from ages 7–13. Figure 7 shows a much smaller and often non-significant increase in reading scores that was similar across ages and across Māori, Pacific and low socio-economic status children. Figure 8 shows no evidence of an effect of the equalization scenarios on hospital admissions for either Māori, Pacific or low socio-economic status children.

Impact on conduct problems of bringing structural, perinatal and parenting factors into line with the general population (equalization scenario) for (a) Māori, (b) Pacific, and (c) low socioeconomic status children.

Impact on reading (Burt score) of bringing structural, perinatal and parenting factors into line with the general population (equalization scenario) for (a) Māori, (b) Pacific, and (c) low socioeconomic status children.
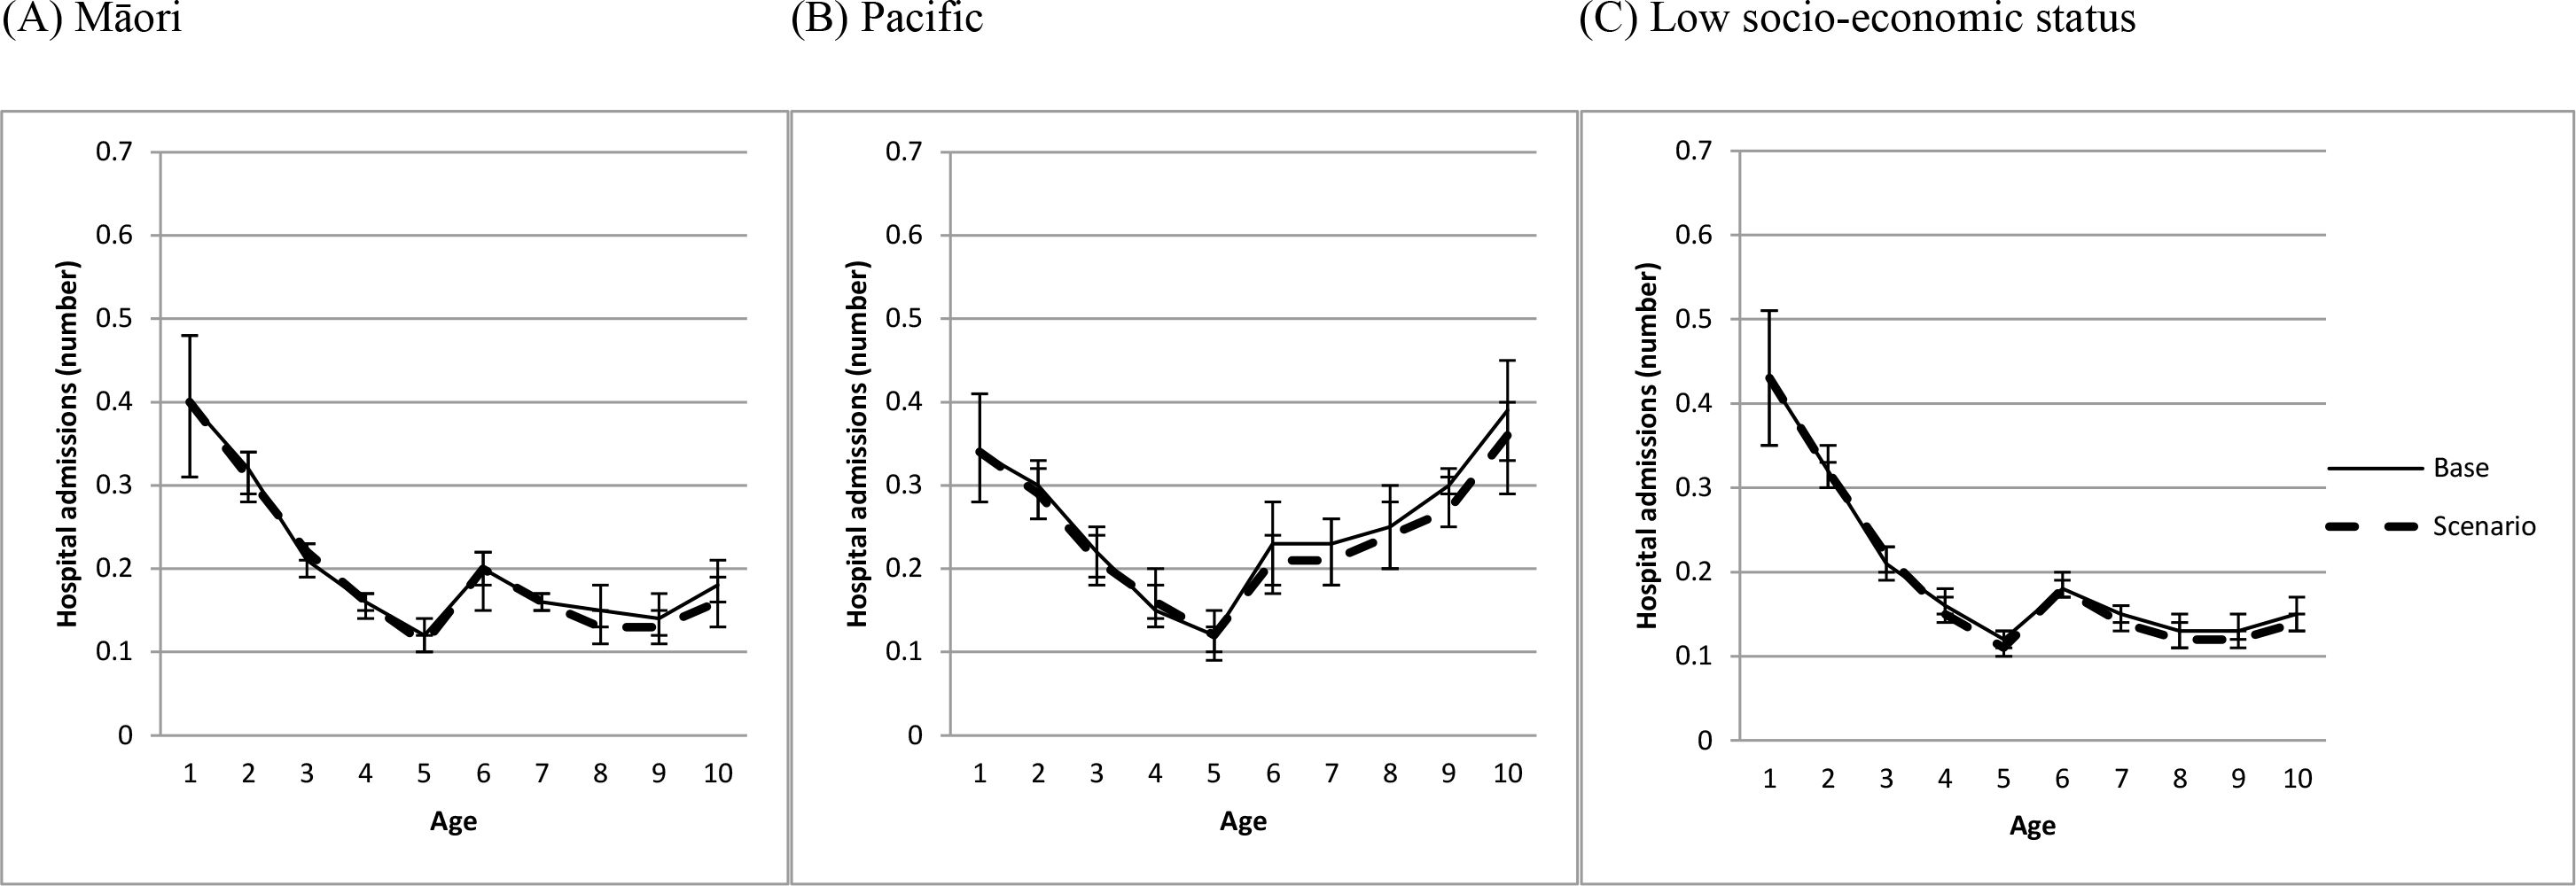

Impact on hospital admissions of bringing structural, perinatal and parenting factors into line with the general population (equalization scenario) for (a) Māori, (b) Pacific, and (c) low socioeconomic status children.
4. Discussion
The purpose of this paper was to demonstrate the Modelling the Early Life-course (MELC) microsimulation model, which was developed to understand the factors upon which policies can be devised to improve the lives of children and young people. The MELC model simulates a representative sample of New Zealand children ageing from birth to age 13, with rules for transitioning children from year to year derived from analysing data from child cohort studies.
The MELC model was able to be validated for three of four outcomes for which external data exist. The model simulated hospital admission results and reading score results that closely matched those of the New Zealand population (from admission records and school-based reading norms). Simulated GP visit numbers were close to those reported in a national survey for ages 2 and 6–10, but underestimated the number of visits for 3–5 year olds and methodological reasons prevented accurate comparisons for the first year of life. The simulation model was calibrated to the national survey estimates to account for the underestimate in years 3–5. However, simulation results for hospital outpatient attendances showed quite different trends to those reported in a national survey. These likely reflect differences between the early life-course trajectory of hospital outpatient attendances reported by the child cohort studies (two of which began in the 1970s) and the early life-course trajectory of hospital outpatient attendances that children in New Zealand experience in the 2000s. While post-modelling calibration was able to bring simulated results in line with national estimates, question marks should remain over modelling this outcome.
Other limitations of the MELC model are worth noting. First, MELC is a discrete-time dynamic MSM with status updates every year, so it not designed to handle events in continuous time. This is sensible for factors in the model that are not ‘events’ (e.g., reading score, conduct problems), but less so for factors that are events (e.g., becoming a child of a single parent). Second, MELC covers a limited lifespan (from birth to age 13) for a limited range of factors. Work is underway to extend the model to early adulthood to encompass transitions out of school into employment or further training, and we also plan to increase the range of factors to broaden the policy relevance of the model.
Third, early childhood education was not a factor in the ‘improving early literacy’ scenario because it was not a strong predictor in the reading model (though it was significant). This was perhaps because the early childhood education experienced by the two older samples (both born in the 1970’s) is likely to be of a different form – focussing on child-minding rather than education – than more recent early childhood education. Whatever the reason, this should be considered a limitation of the model, given the established literature on the importance of early childhood education for later education outcomes (Dearing et al., 2009).
Fourth, MELC simulates a closed cohort rather than a current and growing population (i.e., with births, deaths, immigration and emigration). This is a limitation for policy makers interested in serving a population with changing demographics (~25% of the New Zealand population is foreign born, though only ~10% of the age group MELC models is foreign born). Work is underway to explicitly model births, deaths, immigration and emigration, to extend the model to early adulthood to encompass transitions out of school into employment or further training, and we also plan to increase the range of factors to broaden the policy relevance of the model.
Fifth, it is unclear whether the effects tested in the model can be considered causal. This is an issue for all micro-simulation models driven by estimates from observational data. While analytic techniques have been developed that strengthen a causal interpretation of associations using observational data (e.g., sibling comparison studies, Ellingson et al., 2014; twin studies, van Os et al., 2001; Caspi et al., 2004; in vitro fertilization samples, Gaysina et al., 2013), few have been applied to the associations represented in the MELC model. To our knowledge only one study has, and that study suggests that there is no causal association between breastfeeding and child conduct problems (Shelton et al., 2011). Findings should interpreted with this limitation in mind.
In addition to its empirical underpinning, the strengths of the MELC model include the ability to test scenarios that are relevant to policy makers via a user friendly interface. There is no limit to the number of scenarios that can be run, and the results of different scenarios can be viewed in both tabular and graphical form. The value of micro-simulation in MELC – as opposed to separate statistical modelling of each outcome – is that it incorporates the statistical modelling into one system, which allows policy makers the flexibility to test the impact of (potentially) many X on (potentially) many Y, and also the effect for subgroups of interest, while accounting for the stochastic nature of life transitions (e.g., those with a high probability of X will not necessarily exhibit X). In this sense, simulation provides an efficient way to combine interrelated statistical models to test a wide range of scenarios of interest.
A number of conclusions can be drawn from the scenarios presented in this paper. First, the improving early literacy scenario showed reliable but small improvements to literacy as a result of changing four factors: maternal age, maternal education, birth weight, and living in an owned home. This suggests that even sizeable changes in a number of factors sometimes do not have the large impact desired, perhaps because effect sizes are often small. Also of note here is that the factors found most likely to improve literacy are not typically considered as targets for policy intervention, especially for an education outcome. Thus, while one can imagine policy interventions that could affect all four, it is hard to compare the findings of the scenarios presented to findings in the intervention literature. However, all four factors have been shown to be associated with reading improvements (maternal age: Shaw et al., 2006; maternal education: Magnuson, 2007; birth weight: Chatterji et al., 2014; living in an owned home: Haurin et al., 2002).
Second, the effect of single parenting on conduct problems scenario showed a noticeable and moderate reduction in conduct problems resulting from a sizeable change in single parenting (reducing it from > 20% to 10% in each year of the child’s life). The impact of single parenting on conduct problems has been well-established in the literature (Hill, 2002; Murray & Farrington 2010; Murray et al. 2013), with estimates suggesting that experiencing a change from a two-parent to a single parent household is associated with a 0.2SD increase in conduct scores (Ryan et al., 2014).
Third, the impact on outcomes for Māori, Pacific or low-socio-economic status groups scenario showed mixed results. Altering proportions and means of a number of structural, perinatal and parenting factors relative to the general population for Māori, Pacific or low-socio-economic status resulted in moderate reductions in conduct problems for each of these groups, but only modest improvements to reading, and no change in hospital admissions. The findings for reading and conduct problems mirrored those for the general population in the other two scenarios tested: very small effects on reading and larger effects on conduct problems. The finding for hospital admissions perhaps indicate that the factors that influence ‘generic’ health service use outcomes such as hospital admissions are not easily captured because the risks factors may either be condition-specific (e.g., asthma, Davidson et al., 2010; Algert et al., 2011), or may be clinical factors (e.g., Algert et al., 2011; Gill et al., 2015) rather than the socio-economic or behavioural factors that are the focus of the MELC model. Interestingly, one of the few studies to investigate all-cause hospital admissions found few factors that explained admissions in children aged 2–11: just family income and gestational age explained admissions among boys only, there were no significant factors for girls (Menezes et al., 2010).
Fourth, and more generally, the results of these scenarios emphasise that it is quite difficult to have large impacts on outcomes, even with substantial changes to multiple factors. This perhaps emphasises that multiple areas need to be targeted to have a large impact on children’s lives – there is no “silver bullet” factor that by itself will solve problems in a domain of child functioning.
Variables
| accom | accommodation type |
| age | age of child |
| breast | breast-feeding |
| bthorder | birth order |
| bw | birthweight |
| childethn | ethnicity of child |
| chpar | change in parents |
| chres | number of changes in residence |
| cond | conduct problems |
| fage | father’s age at child’s birth |
| feduc | father’s education level at child’s birth |
| fhrswrk | father’s hours worked |
| fsmoke | father’s smoking |
| ga | gestational age |
| gender | gender of child |
| gpmorb | number of GP visits for a morbidity for the year |
| gpresp | number of GP visits for a respiratory condition for the year |
| gptotvis | total number of GP visits for the year |
| hadm | number of hospital admissions for the year |
| homeown | home ownership |
| householdsize | number of people in household |
| houtp | number of hospital outpatient visits for the year |
| interact | maternal receptiveness |
| kids | number of children in household |
| mage | mother’s age at child’s birth |
| meanaccom1_n | proportion of years that the child was living in an attached house over the period when the child was age 1 to n |
| meanchpar1_n | proportion of years in which the child experienced a change in parents over the period when the child was aged 1 to n |
| meanfhrswrk1_n | mean number of hours worked by father over period when the child was aged 1 to age n |
| meanfsmoke1_n | mean number of cigarettes smoked by the father over the period when the child was aged 1 to age n |
| meanhomeown1_n | proportion of years that the child was living in a house that was not owned or mortgaged over the period when the child was age 1 to n |
| meanhouseholdsize1_n | mean number of people living in the household over the period when the child was aged 1 to n |
| meankids1_n | mean number of children in the family over the period when the child was aged 1 to n |
| meanmhrswrk1_n | mean number of hours worked by mother over period when the child was aged 1 to age n |
| meanmsmoke1_n | mean number of cigarettes smoked by the mother over the period when the child was aged 1 to age n |
| meanovercrowd1_n | proportion of years that the child was living in overcrowded conditions over the period when the child was aged 1 to n |
| meansingle1_n | proportion of years the that the child was in a single parent family from age 1 to age n inclusive |
| meanwelfare1_n | proportion of years that the child was in family on welfare from age 1 to age n inclusive |
| meduc | mother’s educational level at child’s birth |
| mhrswrk | mother’s hours worked |
| msmoke | mother’s smoking |
| npresch | number of years of preschool education |
| overcrowd8 | whether the child was in overcrowded accommodation when aged 8 |
| pregalc | drinking in pregnancy |
| pregsmk | smoking in pregnancy |
| punish | maternal punitiveness |
| read | reading ability |
| sesbth | family’s socio-economic position at child’s birth |
| single | single-parent status |
| single0 | single-parent status at child’s birth |
| twin | singleton or twin birth |
| typeofchange | change in family type from previous to current year (e.g. father left, same number of parents) |
| welfare | welfare dependence |
Appendix
Equations for modifiable factors and outcomes in the MELC micro-simulation model.
| Modifiable factor of outcome | Type of model | Subset of data on which model was estimated | Predictors |
|---|---|---|---|
| Change in single-parent status | Logistic | Children aged 2 to 5 and in a single-parent family in previous year | age childethn fage single0 ga age:fage age:single0 ga:childethn |
| Children aged 2 to 5 and in a two-parent family in previous year | childethn mage mage2 sesbth single0 bw pregsmk sesbth:childethn single0:childethn bw:childethn | ||
| Children aged 6 to 13 and in a single-parent family in previous year | childethn mage feduc ga twin bthorder bthorder2 interact punish punish2 mage:childethn | ||
| Children aged 6 to 13 and in a two-parent family in previous year | childethn mage fage fage2 feduc sesbth single0 pregsmk interact interact2 punish punish2 fage:childethn childethn:feduc single0:childethn pregsmk:childethn interact:childethn punish:childethn | ||
| Change in number of children in household | Standard OLS linear | Children aged 2 to 5 | age typeofchange childethn mage meduc sesbth single0 pregsmk twin bthorder age:childethn age:pregsmk age:twin meduc:childethn sesbth_childethn twin:childethn bthorder:childethn |
| Children aged 6 to 13 | age age2 typeofchange mage mage2 feduc interact interact2 age:mage age:feduc | ||
| Change in parents | Logistic | Children aged 2 to 5 years and no change of residence in previous year | age gender childethn mage sesbth pregsmk single_previous kids_previous mhrswrk_previous welfare_previous typeofchange age:mage age:sesbth age:kids_previous age:mhrswrk_previous |
| Children aged 2 to 5 years and change of residence in previous year | age age2 childethn mage mage2 feduc sesbth single0 bw pregsmk bthorder bthorde2 householdsize_previous welfare_Previous age:mage age:sesbth age:welfare_previous childethn:feduc bw:childethn | ||
| Children aged 6 to 13 years and no | gender childethn mage fage meduc feduc ga ga2 single_previous mhrswrk_previous | ||
| change of residence in previous year | typeofchange fage:childethn childethn:feduc ga:childethn childethn:typeofchange | ||
| Children aged 6 to 13 years and change of residence in previous year | childethn mage feduc bw ga pregalc kids_previous householdsize_previous welfare_previous typeofchange npresch welfare_previous:childethn | ||
| Number of changes in residence for children | Negative binomial | Children aged 2 to 5 | age age2 gender childethn mage mage2 single0 chres_previous pregalc fhrswrk_previous fhrswrk_previous2 welfare_previous age:gender age:chres_previous gender:childethn chres_previous:childethn |
| Children aged 6 to 13 | age childethn fage feduc chres_previous bthorder mhrswrk_previous mhrswrk_previous2 npresch interact age:childethn age:chres_previous age:npresch mhrswrk_previous:childethn | ||
| Welfare dependence | Logistic | Children aged 2 to 5 and family not receiving welfare in previous year | gender childethn meduc sesbth single0 pregalc single kids mhrswrk fhrswrk fhrswrk2 gender:childethn sesbth:childethn mhrswrk:childethn |
| Children aged 2 to 5 and family receiving welfare in the previous year | age age2 gender fage fage2 feduc sesbth ga ga2 breast pregsmk single householdsize mhrswrk mhrswrk2 fhrswrk age:fage age:ga age:single age:householdsize age:fhrswrk | ||
| Children aged 6 to13 and family not receiving welfare in previous year | age meduc sesbth ga breast pregsmk single kids householdsize mhrswrk fhrswrk fhrswrk2 age:single age:householdsize age:fhrswrk | ||
| Children aged 6 to13 and family receiving welfare in previous year | gender childethn meduc feduc sesbth bw ga ga2 pregsmk pregalc pregalc2 single mhrswrk fhrswrk fhrswrk2 interact sesbth:childethn bw:childethn ga:childethn pregsmk:childethn single:childethn interact:childethn | ||
| Mother working | Logistic | Children aged 2 to 5, mother not working in previous year, and is birth-mother | age age2 gender childethn mage meduc feduc single0 ga ga2 breast breast2 pregsmk pregsmk2 pregalc twin bthorder age:gender age:mage age:feduc age:pregalc mage:childethn single0:childethn breast:childethn |
| Children aged 2 to 5, mother not working in previous year, and is not birth-mother, and is not same mother as in previous year | gender | ||
| Children aged 2 to 5, mother not working in previous year, and is not birth-mother, but is same mother as in previous year | ga | ||
| Children aged 2 to 5, mother working in previous year | age gender mage fage fage2 meduc feduc pregsmk pregalc twin age:gender age:mage age:pregalc | ||
| Children aged 6 to 13, mother not working in previous year, and is birth-mother | childethn mage fage meduc sesbth single0 breast breast2 pregsmk pregsmk2 bthorder bthorder2 npresch interact interact2 meduc:childethn sesbth:childethn | ||
| Children aged 6 to 13, mother not working in previous year, and is not birth-mother, and is not same mother as in previous year | childethn sesbth pregsmk pregalc pregalc:childethn | ||
| Children aged 6 to 13, mother not working in previous year, and is not birth-mother, but is same mother as in previous year | gender mage fage ga pregsmk pregsmk2 bthorder npresch | ||
| Children aged 6 to 13 and mother working in previous year | age childethn mage fage fage2 meduc feduc bw bw2 ga breast breast2 pregalc twin npresch age:childethn age:fage age:meduc age:npresch fage:childethn bw:childethn ga:childethn pregalc:childethn twin:childethn | ||
| Number of hours worked per week for working mothers | Negative binomial | Children age 2 to 5 and mother is the child’s birthmother | childethn meduc sesbth single0 mhrswrk_previous ga ga2 breast breast2 mhrswrk_previous:childethn ga:childethn |
| Children age 2 to 5 and mother is not birth-mother, and is not same mother as in previous year | childethn bw twin bthorder bthorder:childethn | ||
| Children age 2 to 5 and mother is not birth-mother, but is same mother as in previous year | childethn mhrswrk_previous pregsmk pregsmk2 pregalc pregsmk:childethn | ||
| Negative binomial with dispersion parameter modelled as quadratic function of age | Children age 6 to 13 and mother is child’s birth-mother | age childethn bthorder npresch mhrswrk_previous age:npresch age:mhrswrk_previous | |
| Negative binomial | Children age 6 to 13 and mother is not birth-mother, and is not same mother as in previous year | childethn meduc feduc sesbth single0 bw ga pregsmk bthorder childethn:feduc bw:childethn ga:childethn bthorder:childethn | |
| Children age 6 to 13 and mother is not birth-mother, but is same mother as in previous year | gender feduc ga pregsmk pregalc pregalc2 twin bthorder interact interact2 | ||
| Father working | Logistic | Children aged 2 to 5, father not working in previous year, and is birth-father | age meduc feduc sesbth |
| Children aged 2 to 5, father not working in previous year, and is not birth-father, and is not same father as in previous year | age age2 mage single0 bthorder age:single0 | ||
| Children aged 2 to 5, father not working in previous year, and is not birth-father, but is same father as in previous year | bw ga ga2 | ||
| Children aged 2 to 5, father working in previous year, and is birth-father | age age2 gender childethn mage mage2 feduc sesbth single0 pregsmk pregsmk2 bthorder age:childethn age:feduc age:sesbth age:single0 age:pregsmk sesbth:childethn | ||
| Children aged 2 to 5, father working in previous year, and is not birth-father, and is not same father as in previous year | fage2 single0 bthorder bthorder2 | ||
| Children aged 2 to 5, father working in previous year, and is not birth-father, but is same father as in previous year | age single0 pregsmk pregsmk2 age:single0 | ||
| Children aged 6 to 13, father not working in previous year, and is birth-father | age childethn sesbth single0 punish punish2 age:single0 age:punish sesbth:childethn punish:childethn | ||
| Children aged 6 to 13, father not working in previous year, and is not birth-father, and is not same father as in previous year | childethn pregsmk pregalc | ||
| Children aged 6 to 13, father not working in previous year, and is not birth-father, but is same father as in previous year | childethn fage fage2 meduc breast npresch fage:childethn npresch:childethn | ||
| Children aged 6 to 13, father working in previous year, and is birth-father | age childethn mage mage2 feduc sesbth single0 pregalc pregalc2 twin bthorder bthorder2 npresch age:childethn mage:childethn | ||
| Children aged 6 to 13, father working in previous year, and is not birth-father, and is not same father as in previous year | age fage breast twin age:twin | ||
| Children aged 6 to 13, father working in previous year, and is not birth-father, but is same father as in previous year | age gender sesbth single0 npresch | ||
| Number of hours worked per week for working fathers | Standard OLS Linear | Children aged 2 to 5 | gender childethn mage feduc sesbth single0 bw ga ga2 pregsmk pregalc fhrswrk_previous childethn:feduc sesbth:childethn pregsmk:childethn fhrswrk_previous:childethn |
| Children aged 6 to 13 and father is child’s birth-father | age gender childethn fage meduc single0 pregsmk pregalc twin npresch fhrswrk_previous age:gender age:childethn age:fage age:pregsmk age:twin gender:childethn pregsmk:childethn fhrswrk_previous:childethn | ||
| Children aged 6 to 13 and father is not birth-father, and is not same father as in previous year | age childethn mage fage sesbth single0 bw pregsmk pregsmk2 pregalc twin npresch interact age:childethn mage:childethn sesbth:childethn single0:childethn pregsmk:childethn twin:childethn npresch:childethn interact:childethn | ||
| Children aged 6 to 13 and father is not birthfather, but is same father as in the previous year | age age2 mage meduc sesbth single0 bw pregalc pregalc2 punish punish2 interact fhrswrk_previous age:single0 age:interact age:fhrswrk_previous | ||
| Accomodation type | Logistic | Children aged 2 to 5 and living in detached house in previous year | age childethn mage mage2 meduc ga pregalc bthorder householdsize mhrswrk welfare age:childethn age:mage ga:childethn pregalc:childethn householdsize:childethn |
| Children aged 2 to 5 and living in attached house in previous year | age age2 childethn mage single0 breast pregalc twin kids householdsize fhrswrk welfare age:mage age:single age:breast kids:childethn householdsize:childethn fhrswrk:childethn | ||
| Children aged 6 to 13 and living in detached house in previous year | gender childethn meduc pregsmk pregsmk22 bthorder single kids householdsize mhrswrk mhrswrk2 fhrswrk welfare punish interact interact single:childethn kids:childethn householdsize:childethn fhrswrk:childethn | ||
| Children aged 6 to 13 and living in attached house in previous year | age gender fage fage2 meduc single0 bw pregsmk pregalc twin single fhrswrk fhrswrk2 punish age:meduc age:pregamk age:pregalc age:fhrswrk age:punish | ||
| Home-ownership | Logistic | Children aged 2 to 5 and did not own home in previous year | age childethn mage sesbth bw kids householdsize mhrswrk fhrswrk fhrswrk2 welfare age:mage age:householdsize age:mhrswrk sesbth:childethn welfare:childethn |
| Children aged 2 to 5 and did own home in previous year | childethn mage feduc sesbth single0 bthorder bthorde2 single single0:childethn | ||
| Children aged 6 to 13 and did not own home in previous year | childethn single kids mage householdsize age age2 fhrswrk meduc kids:childethn householdsize:childethn single:childethn ga ga2 mhrswrk mhrswrk2 pregsmk age:ga breast breast2 | ||
| Children aged 6 to 13 and did own home in previous year | age gender childethn sesbth pregsmk single householdsize fhrswrk fhrswrk2 npresch age:single gender:childethn sesbth:childethn pregsmk:childethn single:childethn fhrswrk:childethn npresch:childethn | ||
| Over-crowding | Logistic | Children aged 2 to 5 and lived in overcrowded accommodation in previous year | age age2 gender pregsmk bthorder single kids householdsize welfare age:gender age:single age:kids age:householdsize age:welfare |
| Children aged 2 to 5 and did not live in overcrowded accommodation in previous year | age gender childethn mage fage fage2 meduc single0 bthorder kids householdsize fhrswrk age:childethn age:bthorder age:kids age:householdsize age:fhrswrk gender:childethn mage:childethn meduc:childethn kids:childethn householdsize:childethn | ||
| Children aged 6 to 13 and lived in overcrowded accommodation in previous year | age age2 gender meduc bw ga breast breast2 pregsmk pregsmk2 bthorder householdsize welfare npresch interact age:meduc age:bw age:breast age:interact | ||
| Children aged 6 to 13 and did not live in overcrowded accommodation in previous year | householdsize mage kids childethn householdsize:childethn mage:childethn age fhrswrk kids:childethn bthorder meduc fage age:fage mage:age fhrswrk:childethn bthorder:childethn twin mhrswrk mhrswrk2 age:mhrswrk kids:age | ||
| Mother smoking | Logistic | Children aged 2 to 5, mother did not smoke in previous year, and is birth-mother | gender childethn mage mage2 breast breast2 pregsmk pregsmk2 mhrswrk gender:childethn mhrswrk:childethn |
| Children aged 2 to 5, mother did not smoke in previous year, and is not birth-mother, and is not same mother as in previous year | age fage fhrswrk welfare | ||
| Children aged 2 to 5, mother did not smoke in previous year, and is not birth-mother, but is same mother as in previous year | bthorder | ||
| Children aged 2 to 5 and mother did smoke in previous year | age age2 fage fage2 sesbth breast pregsmk pregsmk2 welfare age:fage | ||
| Children aged 6 to 13 and mother did not smoke in the previous year | age age2 gender childethn mage meduc feduc sesbth bw bw2 ga pregsmk pregsmk2 twin single householdsize welfare age:gender age:childethn age:mage age:feduc age:sesbth single:childethn welfare:childethn | ||
| Children aged 6 to 13, mother did smoke in previous year, and is birth-mother | age childethn fage meduc sesbth bw breast breast2 pregsmk pregsmk2 bthorder mhrswrk interact interact2 age:sesbth age:mhrswrk meduc:childethn sesbth:childethn bthorder:childethn | ||
| Children aged 6 to 13, mother did smoke in previous year, and is not birth-mother, and is not same mother as in previous year | pregsmk pregalc mhrswrk | ||
| Children aged 6 to 13, mother did smoke in previous year, and is not birth-mother, but is same mother as in previous year | age childethn sesbth ga pregsmk pregsmk2 single mhrswrk npresch interact interact2 age:npresch age:interact ga:childethn single:childethn npresch:childethn interact:childethn | ||
| Number of cigarettes smoked per day for smoking mothers | Standard OLS linear | Children aged 2 to 5 | age childethn feduc msmoke_prevous ga pregsmk pregsmk2 single fhrswrk mhrswrk welfare age:msmoke_prevous age:ga ga:childethn pregsmk:childethn fhrswrk:childeth welfare:childethn |
| Children aged 6 to 13 and mother is child’s birth-mother | age mage mage2 fage fage2 meduc bw bw2 pregsmk bthorder interact interact2 msmoke_previous householdsize mhrswrk welfare age:pregsmk age:msmoke_previous age:mhrswrk | ||
| Children aged 6 to 13 and mother is not birth-mother, and is not same mother as in previous year | age mage meduc sesbth single0 ga breast pregsmk pregsmk2 pregalc npresch msmoke_previous mhrswrk age:pregsmk | ||
| Children aged 6 to 13 and mother is not birth-mother, but is same mother as in previous year | age childethn mage fage fage2 ga pregsmk pregalc twin interact msmoke_previous age:childethn age:pregalc mage:childethn ga:childethn msmoke_prevous:childethn | ||
| Father smoking | Logistic | Children aged 2 to 5, father did not smoke in previous year, and is birth-father | childethn meduc sesbth single0 bw ga breast breast2 twin kids fhrswrk mhrswrk single0:childethn bw:childethn breast:childethn twin:childethn fhrswrk:childethn |
| Children aged 2 to 5, father did not smoke in previous year, and is not birth-father, but is same father as in previous year | childethn fage meduc pregsmk pregalc bthorder single kids mhrswrk mhrswrk2 | ||
| Children aged 2 to 5, father did smoke in previous year, and is birth-father | age gender childethn mage sesbth bw pregsmk single kids fhrswrk fhrswrk2 welfare age:pregsmk age:single age:welfare bw:childethn | ||
| Children aged 2 to 5, father did smoke in previous year, and is not birth-father, and is not same father as in previous year | age childethn fage meduc feduc | ||
| Children aged 2 to 5, father did smoke in previous year, and is not birth-father, and is not same father as in previous year | single0 pregalc householdsize | ||
| Children aged 2 to 5, father did smoke in previous year, and is not birth-father, but is same father as in previous year | childethn sesbth single0 ga ga2 pregsmk fhrswrk sesbth:childethn single0:childethn ga:childethn pregsmk:childethn | ||
| Children aged 6 to 13, father did not smoke in previous year, and is birth-father | age age2 gender childethn fage feduc sesbth bw ga ga2 breast pregalc single householdsize fhrswrk mhrswrk mhrswrk2 welfare npresch interact age:feduc age:mhrswrk gender:childethn childethn:feduc sesbth:childethn bw:childethn householdsize:childethn | ||
| Children aged 6 to 13, father did not smoke in previous year, and is not birth-father, and is not same father as in previous year | age fage feduc pregsmk single kids householdsize mhrswrk welfare npresch interact age:fage | ||
| Children aged 6 to 13, father did not smoke in previous year, and is not birth-father, but is same father as in previous year | age feduc pregsmk pregalc kids fhrswrk mhrswrk mhrswrk2 punish | ||
| Children aged 6 to 13, father did smoke in previous year | gender childethn meduc feduc bw bw2 pregsmk bthorder single kids fhrswrk mhrswrk npresch interact childethn:feduc fhrswrk:childethn | ||
| Number of cigarettes smoked per day for smoking fathers | Standard OLS linear | Children aged 2 to 5 and father is child’s birth-father | age childethn fsmoke_previous ga pregsmk bthorder welfare age:fsmoke_previous age:ga age:pregsmk age:welfare fsmoke_previous:childethn pregsmk:childethn |
| Children aged 2 to 5 and father is not birth-father, and is not same father as in previous year | childethn bw fsmoke_previous bw bw2 pregsmk pregsmk2 welfare | ||
| Children aged 2 to 5 and father is not birth-father, but is same father as in previous year | age mage mage2 single0 fsmoke_previous pregalc pregalc2 age:single0 | ||
| Children aged 6 to 13 and father is child’s birth-father | childethn mage fage feduc sesbth breast breast2 pregsmk pregsmk2 pregalc interact interact2 fsmopke_previous single mage:childethn fage:childethn breast:childethn interact:childethn single:childethn | ||
| Children aged 6 to 13 and father is not birth-father, and is not same father as in previous year | meduc bw pregsmk pregsmk2 pregalc npresch punish interact fsmoke_previous single kids householdsize mhrswrk welfare | ||
| Children aged 6 to 13 and father is not birth-father, but is same father as in previous year | gender single0 bw bthorder interact fsmoke_previous kids fhrswrk mhrswrk mhrswrk2 | ||
| Mother’s emotional responsiveness | Negative binomial | Children at age 5 | gender childethn mage mage2 sesbth single0 bw breast breast2 pregsmk meankids1_5 meanmhrswrk1_5 meanwelfare1_5 meanaccom1_5 meanovercrowd1_5 meanchpar1_5 meanchres1_5 breast:childethn meankids1_5:childethn |
| Number of years of preschool education | Standard OLS linear | Children at age5 | meduc feduc sesbth breast meanhouseholdsize1_5 meanaccom1_5 meanchres1_5 meanmsmoke1_5 |
| Mother’s punitiveness | Poisson | Children at age5 | gender childethn fage meduc meanmhrswrk1_5 meanhomeown1_5 meanchpar1_5 meduc:childethn meanmhrswrk1_5:childethn meanhomeown1_5:childethn |
| Total family doctor visits | Negative binomial | Children aged 2 years | childethn fage fage2 meduc feduc sesbth gptotvis_previous kids_previous fage:childethn gptotvis_previous:childethn |
| Children aged 3 to 5 years | age age2 childethn meduc single0 bthorder gptotv’s_previous householdsize_previous fhrswrk_previous overcrowd_previous age:bthorder age:fhrswrk_previous meduc:childethn single0:childethn | ||
| Children aged 6 years | childethn meduc single0 pregsmk npresch punish punish2 gptotvis_previous kids_previous accom_previous overcrowd_previous punish:childethn gptotv’s_previous:childethn | ||
| Children aged 7 to 10 years | age age2 childethn punish interact gptotv’s_previous kids_previous fhrswrk_previous age:gptotv’s_previous age:kids_previous punish:childethn interact:childethn fhrswrk_previous:childethn | ||
| Number of visits to a GP for a morbidity | Negative binomial | Children aged 2 | childethn single_previous chpar_previous gptotvis gpresp chpar_previous:childethn gptotv’s:childethn |
| Children aged 3 and 4 | age gender childethn feduc single_previous kids_previous welfare_previous accom_previous gptotv’s gpresp age:welfare_previous gender:childethn childethn:feduc single_previous:childethn welfare_previous:childethn accom_previous:childethn gptotvis:childethn gpresp:childethn | ||
| Children aged 5 | childethn mage meduc twin bthorder fhrswrk_previous welfare_previous gptotvis gpresp gptotvis:childethn gpresp:childethn | ||
| Children aged 6 and 7 | age childethn meduc gpmorb_previous single_previous fhrswrk_previous fhrswrk_previous2 overcrowd_previous gptotv’s gpresp age:fhrswrk_previous age:overcrowd_previous meduc:childethn fhrswrk_previous:childethn overcrowd_previous:childethn gptotvis:childethn gpresp:childethn | ||
| Number of preventative visits to a GP | Standard OLS linear | Children aged 2 | childethn mage bthorder welfare_previous gptotvis gpresp gpmorb welfare_previous:childethn gptotv’s:childethn gpresp:childethn gpmorb:childethn |
| Poisson | Children aged 3 and 4 age | childethn mage fage single0 bw breast bthorder gptotvis gpresp gpmorb age:bw age:breast age:bthorder age:gptotvis age:gpresp age:gpmorb mage:childethn fage:childethn gptotvis:childethn gpresp:childethn gpmorb:childethn | |
| Children aged 5 | mage meduc bw ga pregsmk2 welfare_previous fsmoke_previous fsmoke_previous2 gptotvis gpresp gpmorb | ||
| Children aged 6 and 7 | age meduc sesbth single0 breast chpar_previous gptotvis gpresp gpmorb age:meduc age:sesbth age:single0 age:breast age:chpar_previous age:gptotvis age:gpresp age:gpmorb | ||
| Number of visits to a GP for a respiratory condition | Negative binomial | Children aged 2 to 5 | age age2 childethn feduc sesbth gpresp_previous fhrswrk_previous homeown_previous fsmoke_previous gptotvis age:childethn age:gptotvis childethn:feduc sesbth:childethn fhrswrk_previous:childethn gptotvis:childethn |
| Children aged 6 to 1O | age age2 childethn pregalc gpresp_previous welfare_previous npresch gptotvis age:childethn age:gpresp_previous age:gptotvis gpresp_previous:childethn npresch:childethn gptotvis:childethn | ||
| Number of hospital admission | Poisson | Children aged 2 to 5 | aage gender hadm_previous chres_previous fsmoke_previous age:hadmtot_previous age:fsmoke_previous |
| Children aged 6 to 1O | age age2 gender childethn fage sesbth bw ga punish hadmtot_previous kids_previous householdsize_previous mhrswrk_previous mhrswrk_previous2 age:gender age:childethn age:fage age:sesbth age:bw age:ga age:punish age:hadmtot_previous age:kids_previous age:householdsize_previous age:mhrswrk_previous hadmtot_previous:childethn kids_previous:childethn | ||
| Number of hospital outpatient visits | Negative binomial | Children aged 2 to 5 | age gender childethn fage meduc breast bthorder houtp_previous fhrswrk_previous welfare_previous homeown_previous overcrowd_previous chpar_previous fage:childethn meduc:childethn houtp_previous:childethn fhrswrk_previous:childethn homeown_previous:childethn overcrowd_previous:childethn chpar_previous:childethn |
| Children aged 6 to 1O | age meduc bw bthorder punish houtp_previous kids_previous welfare_previous accom_previous overcrowd_previous chpar_previous msmoke_previous age:punish age:houtp_previous age:welfare_previous age:chpar_previous age:msmoke_previous | ||
| Conduct score | Logistic | Children aged 4 | age gender childethn mage fage meduc breast breast2 bthorder chres meanmhrswrk1_3 meanwelfare1_3 meanhomeown1_3 age:fage mage:childethn fage:childethn chres:childethn |
| Children aged 5 years and no conduct problem in the previous year | gender childethn feduc sesbth breast single fhrswrk fhrswrk2 accom single:childethn | ||
| Children aged 5 years and with conduct problem in the previous year | age childethn fage ga chpar homeown:childethn chpar:childethn | ||
| Children aged 6 to 13 years and with conduct problem in the previous year | age gender childethn feduc sesbth single0 breast kids accom fsmoke msmoke msmoke2 npresch age:fsmoke single0:childethn kids:childethn | ||
| Reading score | Standard OLS linear | Children aged 8 years | gender childethn mage meduc bw bw2 breast bthorder bthorder2 householdsize fhrswrk msmoke interact punish meansingle1_7 meanwelfare1_7 meanfsmoke1_7 mage:childethn |
| Children aged 9 to 13 years | age childethn mage sesbth ga ga2 breast bthorder bthorde2 homeown overcrowd reading_previous npresch interact interact2 age:bthorder age:overcrowd age:reading_previous age:npresch age:interact |
-
‘_previous’ suffix denotes that the variable is the value for the year prior to the current year.
-
2
superscript denotes that the variable has been squared.
x:y denotes an interaction between variable x and variable y
Missing data: Time-invariant variables – Christchurch health and development study (N = 1265).
| Variable | Number of missing values | % |
|---|---|---|
| Gender | 0 | 0% |
| Ethnicity | 0 | 0% |
| Age of mother at child’s birth | 2 | 0.2% |
| Age of father at child’s birth | 4 | 0.3% |
| Mother’s education at child’s birth | 2 | 0.2% |
| Father’s education at child’s birth | 0 | 0% |
| Family’s SES at child’s birth | 0 | 0% |
| Single-parent status at the child’s birth | 0 | 0% |
| Birth weight | 3 | 0.2% |
| Multiple birth | 0 | 0% |
| Gestational age | 37 | 2.9% |
| Birth order | 0 | 0% |
| Smoking during pregnancy | 0 | 0% |
| Drinking during pregnancy | 1 | 0.1% |
| Breastfeeding | 85 | 6.7% |
| Maternal responsiveness | 115 | 9.1% |
| Maternal punitiveness | 115 | 9.1% |
| Early childhood education | 234 | 18.5% |
Missing data: Time-varying variables by year – Christchurch health and development study (N = 1265).
| Year 1 | Year 2 | Year 3 | Year 4 | Year 5 | Year 6 | Year 7 | Year 8 | Year 9 | Year 1O | Year 11 | Year 12 | Year 13 | ||||||||||||||
|---|---|---|---|---|---|---|---|---|---|---|---|---|---|---|---|---|---|---|---|---|---|---|---|---|---|---|
| Variable | N. Miss | % | N. Miss | % | N. Miss | % | N. Miss | % | N. Miss | % | N. Miss | % | N. Miss | % | N. Miss | % | N. Miss | % | N. Miss | % | N. Miss | % | N. Miss | % | N. Miss | % |
| Single-parent status | 1O2 | 8.1 | 128 | 1O.1 | 141 | 11.1 | 174 | 13.8 | 18O | 14.2 | 2O2 | 16 | 2OO | 15.8 | 252 | 19.9 | 279 | 22.1 | 3O4 | 24 | 342 | 27 | 398 | 31.5 | 426 | 33.7 |
| Number of children | 1O2 | 8.1 | 128 | 1O.1 | 141 | 11.1 | 174 | 13.8 | 18O | 14.2 | 2O2 | 16 | 2OO | 15.8 | 252 | 19.9 | 279 | 22.1 | 3O4 | 24 | 342 | 27 | 398 | 31.5 | 426 | 33.7 |
| Number of household members | 1O2 | 8.1 | 128 | 1O.1 | 141 | 11.1 | 174 | 13.8 | 18O | 14.2 | 2O2 | 16 | 2OO | 15.8 | 252 | 19.9 | 279 | 22.1 | 3O4 | 24 | 342 | 27 | 398 | 31.5 | 426 | 33.7 |
| Mother’s working hours | 1O6 | 8.4 | 133 | 1O.5 | 15O | 11.9 | 188 | 14.9 | 184 | 14.5 | 2O9 | 16.5 | 215 | 17 | 252 | 19.9 | 28O | 22.1 | 3O5 | 24.1 | 342 | 27 | 398 | 31.5 | 426 | 33.7 |
| Father’s working hours | 112 | 8.9 | 145 | 11.5 | 159 | 12.6 | 183 | 14.5 | 2O4 | 16.1 | 216 | 17.1 | 2O6 | 16.3 | 254 | 2O.1 | 283 | 22.4 | 3O9 | 24.4 | 343 | 27.1 | 399 | 31.5 | 427 | 33.8 |
| Welfare dependent | 1O2 | 8.1 | 128 | 1O.1 | 141 | 11.1 | 174 | 13.8 | 18O | 14.2 | 2O2 | 16 | 2OO | 15.8 | 253 | 2O | 279 | 22.1 | 3O4 | 24 | 342 | 27 | 398 | 31.5 | 426 | 33.7 |
| Change of parents | 1O5 | 8.3 | 128 | 1O.1 | 141 | 11.1 | 174 | 13.8 | 18O | 14.2 | 2O2 | 16 | 2OO | 15.8 | 252 | 19.9 | 279 | 22.1 | 3O4 | 24 | 342 | 27 | 398 | 31.5 | 426 | 33.7 |
| Mother smoking | 1O5 | 8.3 | 128 | 1O.1 | 141 | 11.1 | 174 | 13.8 | 18O | 14.2 | 2O2 | 16 | 2OO | 15.8 | 252 | 19.9 | 279 | 22.1 | 3O4 | 24 | 342 | 27 | 398 | 31.5 | 426 | 33.7 |
| Father smoking | 1O2 | 8.1 | 128 | 1O.1 | 145 | 11.5 | 176 | 13.9 | 181 | 14.3 | 2O2 | 16 | 2OO | 15.8 | 252 | 19.9 | 279 | 22.1 | 3O4 | 24 | 342 | 27 | 398 | 31.5 | 426 | 33.7 |
| Accommodation type | 1O5 | 8.3 | 133 | 1O.5 | 152 | 12 | 18O | 14.2 | 186 | 14.7 | 2O2 | 16 | 2OO | 15.8 | 252 | 19.9 | 279 | 22.1 | 3O4 | 24 | 344 | 27.2 | 4OO | 31.6 | 427 | 33.8 |
| Housing tenure (owned/rented) | 1O2 | 8.1 | 128 | 1O.1 | 141 | 11.1 | 174 | 13.8 | 18O | 14.2 | 2O2 | 16 | 2OO | 15.8 | 252 | 19.9 | 279 | 22.1 | 3O4 | 24 | 342 | 27 | 398 | 31.5 | 426 | 33.7 |
| Overcrowding | 1O2 | 8.1 | 128 | 1O.1 | 141 | 11.1 | 174 | 13.8 | 18O | 14.2 | 2O2 | 16 | 2OO | 15.8 | 252 | 19.9 | 279 | 22.1 | 3O4 | 24 | 342 | 27 | 398 | 31.5 | 426 | 33.7 |
| GP visits | 111 | 8.8 | 136 | 1O.8 | 142 | 11.2 | 179 | 14.2 | 182 | 14.4 | 2O4 | 16.1 | 2OO | 15.8 | 252 | 19.9 | 279 | 22.1 | 3O5 | 24.1 | - | - | - | - | - | - |
| Hospital admissions | 1O5 | 8.3 | 122 | 9.6 | 139 | 11 | 174 | 13.8 | 178 | 14.1 | 2O2 | 16 | 2OO | 15.8 | 252 | 19.9 | 279 | 22.1 | 3O4 | 24 | - | - | - | - | - | - |
| Hospital outpatient attendances | 1O5 | 8.3 | 122 | 9.6 | 139 | 11 | 175 | 13.8 | 179 | 14.2 | 2O3 | 16 | 2OO | 15.8 | 252 | 19.9 | 279 | 22.1 | 3O4 | 24 | - | - | - | - | - | - |
| Reading ability | - | - | - | - | - | - | - | - | - | - | - | - | - | - | 26O | 2O.6 | 289 | 22.8 | 315 | 24.9 | 349 | 27.6 | 4O8 | 32.3 | 437 | 34.5 |
| Conduct problems | - | - | - | - | - | - | - | - | - | - | 2O3 | 16 | 2OO | 15.8 | 252 | 19.9 | 279 | 22.1 | 3O5 | 24.1 | - | - | - | - | - | - |
Missing data: Time-invariant variables – Dunedin multidisciplinary health and development study (N = 1037).
| Variable | Number of missing values | % |
|---|---|---|
| Gender | 0 | 0% |
| Ethnicity | 3 | 0.3% |
| Age of mother at child’s birth | 4 | 0.4% |
| Age of father at child’s birth | 28 | 2.7% |
| Mother’s education at child’s birth | 4 | 0.4% |
| Father’s education at child’s birth | 51 | 4.9% |
| Family’s SES at child’s birth | 97 | 9.4% |
| Single-parent status at the child’s birth | 0 | 0% |
| Birth weight | 2 | 0.2% |
| Multiple birth | 122 | 11.8% |
| Gestational age | 0 | 0% |
| Birth order | 2 | 0.2% |
| Smoking during pregnancy | 7 | 0.7% |
| Drinking during pregnancy | 2 | 0.2% |
| Breastfeeding | 49 | 4.7% |
| Maternal responsiveness | 2 | 0.2% |
| Maternal punitiveness | 261 | 25.2% |
| Early childhood education | 0 | 0% |
Missing data: Time-varying variables by year – Dunedin multidisciplinary health and development study (N = 1037).
| Year 3 | Year 5 | Year 7 | Year 9 | Year 11 | Year 13 | |||||||
|---|---|---|---|---|---|---|---|---|---|---|---|---|
| Variable | N. Miss | % | N. Miss | % | N. Miss | % | N. Miss | % | N. Miss | % | N. Miss | % |
| Number of children | 0 | 0 | - | - | 90 | 8.7 | - | - | 133 | 12.8 | - | - |
| Number of household members | 0 | 0 | - | - | - | - | - | - | - | - | - | - |
| Mother’s working hours | 0 | 0 | 51 | 4.9 | 90 | 8.7 | 107 | 10.3 | 135 | 13.0 | - | - |
| Change of parents | - | - | - | - | - | - | - | - | 133 | 12.8 | - | - |
| Change of residence | 4 | 0.4 | 59 | 5.7 | 91 | 8.8 | 89 | 8.6 | 133 | 12.8 | - | - |
| Mother smoking | - | - | - | - | - | - | 244 | 23.5 | 142 | 13.7 | - | - |
| Father smoking | - | - | - | - | - | - | 289 | 27.9 | 157 | 15.1 | - | - |
| Accommodation type | 5 | 0.5 | - | - | - | - | - | - | - | - | - | - |
| Housing tenure (owned/rented) | 16 | 1.5 | - | - | - | - | - | - | - | - | - | - |
| GP visits | - | - | - | - | 163 | 15.7 | 223 | 21.5 | 147 | 14.2 | - | - |
| Hospital admissions | 3 | 0.3 | 52 | 5.0 | 162 | 15.6 | 222 | 21.4 | 184 | 17.4 | 215 | 20.7 |
| Hospital outpatient attendances | 1 | 0.1 | 51 | 4.9 | - | - | - | - | 142 | 13.7 | - | - |
| Reading ability | - | - | - | - | 95 | 9.2 | 85 | 8.2 | 118 | 11.4 | 210 | 20.3 |
| Conduct problems | - | - | 25 | 2.4 | 86 | 8.3 | 89 | 8.6 | 117 | 11.3 | 48 | 4.6 |
Missing data: Time-invariant variables – Pacific Islands families study (N = 1398).
| Variable | Number of missing values | % |
|---|---|---|
| Ethnicity | 17 | 1.2 |
| Age of mother at child’s birth | 1 | 0.1 |
| Age of father at child’s birth | 565 | 40.4 |
| Mother’s education at child’s birth | 0 | 0 |
| Father’s education at child’s birth | 565 | 40.4 |
| Birth weight | 17 | 1.2 |
| Multiple birth | 0 | 0 |
| Gestational age | 19 | 1.4 |
| Birth order | 17 | 1.2 |
| Smoking during pregnancy | 6 | 0.4 |
| Drinking during pregnancy | 0 | 0 |
| Maternal punitiveness | 94 | 6.7 |
| Early childhood education | 539 | 38.6 |
Missing data: Time-varying variables by year – Pacific Islands families study (N = 1398).
| Year | Year 2 | Year 4 | Year 6 | Year 9 | ||||||
|---|---|---|---|---|---|---|---|---|---|---|
| Variable | N. Miss | % | N. Miss | % | N. Miss | % | N. Miss | % | N. Miss | % |
| Single-parent status | 563 | 40.3 | - | - | - | - | - | - | - | - |
| Number of household members | 0 | 0 | - | - | - | - | - | - | - | - |
| Mother smoking | 162 | 11.6 | 244 | 17.5 | 340 | 24.3 | 393 | 28.1 | - | - |
| Father smoking | 570 | 40.8 | - | - | - | - | - | - | - | - |
| Accommodation type | 1 | 0.1 | - | - | - | - | - | - | - | - |
| Housing tenure (owned/rented) | 157 | 11.2 | 236 | 16.9 | 332 | 23.7 | 381 | 27.3 | 424 | 30.3 |
| Overcrowding | 0 | 0 | - | - | - | - | - | - | - | - |
| GP visits for a morbidity | 157 | 11.2 | 237 | 17.0 | 334 | 23.9 | 379 | 27.1 | 385 | 27.5 |
| Hospital admissions | 158 | 11.3 | 237 | 17.0 | 332 | 23.7 | 379 | 27.1 | 386 | 27.6 |
| Conduct problems | - | - | - | - | 333 | 23.8 | - | - | 420 | 30.0 |
References
-
1
Breastfeeding is associated with reduced childhood hospitalization: evidence from a Scottish Birth Cohort (1997–2009)J Pediatr 166:620–5.
-
2
Pregnancy exposures and risk of childhood asthma admission in a population birth cohortPediatr Allergy Immunol 22:836–42.
-
3
Effects of maternal prenatal smoking and birth outcomes extending into the normal range on academic performance in fourth grade in North Carolina, USAPaediatr Perinat Epidemiol 27:564–74.
-
4
Home ownership and the emotional and behavioral problems of children and youthChild Dev 73:883–92.
-
5
Childhood hospitalisation with infection and cardiovascular disease in early-mid adulthood: a longitudinal population-based studyPLoS One 10:e0125342.
-
6
Maternal expressed emotion predicts children's antisocial behavior problems: using monozygotic-twin differences to identify environmental effects on behavioral developmentDev Psychol 40:149–61.
- 7
-
8
Academic achievement despite child maltreatment: a longitudinal studyChild Abuse Negl 35:688–99.
-
9
The role of maternal education and nonmaternal care services in the prevention of children's physical aggression problemsArch Gen Psychiatry 64:1305–12.
-
10
Influence of maternal and perinatal factors on subsequent hospitalisation for asthma in children: evidence from the Oxford record linkage studyBMC Pulm Med 10:14.
-
11
Does higher quality early child care promote low-income children's math and reading achievement in middle childhood?Child Dev 80:1329–49.
-
12
Dynamic microsimulation modeling for policy support: An application to Belgium and possibilities for JapanRev Socionetwork Strat 6:31–47.
-
13
A sibling-comparison study of smoking during pregnancy and childhood psychological traitsBehav Genet 44:25–35.
-
14
Trends in hospitalization rates and severity of injuries from abuse in young children, 1997-2009Pediatrics 131:e1796–802.
-
15
The Christchurch Health and Development Study: Review of Findings on Child and Adolescent Mental HealthAustralian and New Zealand Journal of Psychiatry 35:287–296.
-
16
Assessing and addressing Māori outcomes: Preliminary findings from Te Hoe Nuku Roa Māori Household ResearchNew Zealand Population Review 26:115–121.
-
17
Maternal smoking during pregnancy and offspring conduct problems: evidence from 3 independent genetically sensitive research designsJAMA Psychiatry 70:956–63.
- 18
-
19
Identification of children at risk of influenza-related complications in primary and ambulatory care: a systematic review and meta-analysisLancet Respir Med 3:139–149.
-
20
Burt Word Reading Test, New Zealand RevisionWellington: New Zealand Council for Educational Research.
-
21
Family policy, family structure, and children's educational achievementSoc Sci Res 42:804–17.
-
22
APPSIM: The Australian Dynamic Population and Policy Microsimulation ModelCanberra, Australia: National Centre for Social and Economic Modeling.
- 23
-
24
Biological, psychological and social processes in the conduct disordersJournal of Child Psychology and Psychiatry 43:133–164.
-
25
Life with (or without) father: the benefits of living with two biological parents depend on the father's antisocial behaviorChild Dev 74:109–26.
-
26
Determinants and disparities: A simulation approach to the case of child health careSocial Science and Medicine 128:202–211.
-
27
Evaluating Binary Alignment Methods in Microsimulation ModelsJournal of Artificial Societies and Social Simulation 17:15.
-
28
Breastfeeding and later psychosocial development of children at 6 years of agePediatrics 134:S36–41.
- 29
-
30
Exploring the relation of harsh parental discipline with child emotional and behavioral problems by using multiple informants. The generation R studyPLoS One 9:e104793.
-
31
Maternal Education and Children's Academic Achievement During Middle ChildhoodDev Psychol 43:1497–1512.
-
32
JAMSIM: A Micro-simulation Modeling Policy ToolJournal of Artificial Societies and Social Simulation 15:8.
-
33
The effect of breastfeeding on children's educational test scores at nine years of age: results of an Irish cohort studySoc Sci Med 72:1515–21.
-
34
Regression-Style Models for Parameter Estimation in Dynamic Microsimulation: An Empirical Performance Assessment.International Journal of Microsimulation 8:83–127.
-
35
Hospital admissions from birth to early adolescence and early-life risk factors: the 11-year follow-up of the 1993 Pelotas (Brazil) birth cohort study.Cad Saude Publica 26:1980–9.
-
36
A collaborative approach to bridging the research-policy gap through the development of policy advice softwareEvidence and Policy 10:127–136.
-
37
The Health of New Zealand Children 2011/12: Key findings of the New Zealand Health SurveyWellington: Ministry of Health.
-
38
Inter-agency plan for conduct disorder/ severe antisocial behaviour. 2007-2012Wellington: Ministry of Social Development.
-
39
Epidemiology of childhood conduct problems in Brazil: systematic review and meta-analysiset al 48:1527–1538.
-
40
Risk factors for conduct disorder and delinquency: key findings from longitudinal studiesCan J Psychiatry 55:633–42.
-
41
National Minimum Dataset (Hospital Events) Data DictionaryNational Minimum Dataset (Hospital Events) Data Dictionary, Wellington, Ministry of Health.
-
42
Prediction of differential adult health burden by conduct problem subtypes in malesArchives of General Psychiatry 64:476–484.
-
43
http://ascape.sourceforge.net/Ascape.
-
44
Cohort profile, The Pacific Islands Families (PIF) StudyInternational Journal of Epidemiology 37:273–279.
-
45
Early detection of children at risk for antisocial behaviour using data from routine preventive child healthcareBMC Pediatr 12:24.
-
46
A Geospatial Dynamic Microsimulation Model for Household Population ProjectionsInt J Microsimulation 7:119–146.
-
47
Associations Between Family Structure Change and Child Behavior Problems: The Moderating Effect of Family IncomeChild Dev, doi: 10.1111/cdev.12283.
- 48
-
49
Teenage children of teenage mothers: Psychological, behavioural and health outcomes from an Australian prospective longitudinal studySoc Sci Med 62:2526–2539.
-
50
Using a genetically informative design to examine the relationship between breastfeeding and childhood conduct problemsEur Child Adolesc Psychiatry 20:571–9.
-
51
From child to adult: The Dunedin Multidisciplinary Health and Development StudyAuckland: Oxford University Press.
-
52
A conceptual framework for action on the social determinants of health. Discussion paper 2Geneva: World Health Organization.
- 53
-
54
http://www.stats.govt.nz/tools and services/university-students/2006-census-birth-cohort.aspx2006 Census birth cohort SURF.
-
55
http://www.stats.govt.nz/Census/2006CensusHomePage/QuickStats/quickstats-about-a-subject/Māori.aspxQuick Stats About Maori.
-
56
Longitudinal study of behaviour disorders in low birthweight infantsArch Dis Child Fetal Neonatal Ed 81:F5–9.
-
57
Growth curve analyses of the relationship between early maternal age and children's mathematics and reading performanceSoc Sci Res 50:343–66.
-
58
A prospective twin study of birth weight discordance and child problem behaviorBiol Psychiatry 50:593–9.
-
59
Maternal education in relation to early and late child health outcomes: findings from a Brazilian cohort studySoc Sci Med 34:899–905.
-
60
Perinatal origins of first-grade academic failure: role of prematurity and maternal factorsPediatrics 131:693–700.
-
61
Research review: The relationship between childhood violence exposure and juvenile antisocial behavior: a meta-analytic reviewJ Child Psychol Psychiatry 50:769–79.
- 62
-
63
The long-term contribution of early childhood education to children’s performance – evidence from New ZealandInt J Early Years Education 11:69–78.
Article and author information
Author details
Acknowledgements
This research was funded by grant UOAX0802 from the New Zealand Ministry of Business, Innovation and Employment. All authors are independent from the funding sources. We would like to thank the Christchurch Health and Development Study, Dunedin Multidisciplinary Health and Development Study, Pacific Islands Families Study, and Te Hoe Nuku Roa Study for allowing us to use their data, and the children and parents from each study for participating in assessments. We would also like to thank Wendy Wrapson and Oliver Mannion for their help with the development of the model.
Publication history
- Version of Record published: August 31, 2015 (version 1)
Copyright
© 2015, Milne
This article is distributed under the terms of the Creative Commons Attribution License, which permits unrestricted use and redistribution provided that the original author and source are credited.