Microsimulation of language dynamics in a multilingual region with high immigration
- INRS – Centre Urbanisation Culture Société, Canada
Abstract
In high immigration countries, linguistic integration to the host society may constitute an important economic, social and political issue. This is likely to be even more salient in countries where two or more languages are already competing. Canada is an officially bilingual country characterized by a low fertility and a high immigration regime. This paper describes a dynamic microsimulation model projecting the population of Canada and its regions by mother tongue and language used at home. Emphasis is put on the language module of the model which allows for changes in language characteristics, namely intergenerational changes in mother tongue and intragenerational changes in home language. Mother tongue and home language are then projected for different scenarios in order to investigate the impact of changes in levels and linguistic composition of immigration. Different hypothesis with regard to language preferences of immigrants (which may be influenced through language management legislation) are also taken into account. Results are presented for two regions, the province of Quebec and the rest of Canada at the horizon 2051 as well as for the stable population. Projection results show that the population of non-official mother tongues will increase rapidly to reach 31% in 2051. More interestingly, the results show that the increase in home language is less important due to language shifts. Since these are more favourable to English than French, the ratio of English speakers to French speakers is increasing both in Québec and in the rest of Canada, thus shifting the equilibrium between official languages
1. Introduction
Language is a vector of culture and identity, and a ubiquitous element of social life. The first language learnt at home in childhood (the mother tongue) generally constitutes a major piece of the self, a way to construct one’s own view of the world. Language is even thought to influence how we think and process information (Crystal, 2000; Deutscher, 2010).
Language characteristics are not static. Some aspects of a person’s language practices may change in the course of his or her lifetime. Although most people around the world make use of their mother tongue in their routine activities, many, such as national minorities and immigrants, have to use a second or even a third language to get by in their private and public life, notably to interact with colleagues at work, to benefit from government services or to buy day-to-day goods. For immigrants, the knowledge and use of the dominant language is often a fundamental prerequisite to economic and cultural integration to the host society. In the absence of a constant influx of immigration, immigrants’ own languages are relatively short-lived. Studies have shown that grand- children of original immigrants seldom use the language of their grand-parents, most notably as their main language spoken at home (Bélanger, Lachapelle, & Sabourin, 2011; Rumbaut, Massey, & Bean, 2006).
In high immigration countries, the rate at which newcomers learn and adopt the majority language of the host society may constitute an important economic and political issue. In advanced economy, language proficiency and literacy in general have been shown to be key aspects of immigrants’ successful integration in the labour market and are strongly related to higher employment rates and higher income (Chiswick & Miller, 1999, 2002). Conversely, a low level of literacy has been shown to be an important factor in the overqualification of immigrants with otherwise strong human capital (Bonikowska, Riddell, & Green, 2008; Ferrer, Green, & Riddell, 2006; Green & Craig Riddell, 2003; Wald & Fang, 2008). For linguistically diverse societies, language may also be a potential source of cultural insecurity and political conflict, as is the case in Québec, Catalonia or Belgium (Blommaert, 2011; Fishman, 1991).
Because the language characteristics of a population have social, economical, demographical and political relevance, some insights on language dynamics can be useful to policymakers, especially in high immigration countries. But as true as this may be, language elements are rarely included in national projection models, most often due to a lack of data, but also because of taboos in regions where language has become a sensitive political issue (Belgium being an emblematic example). Canada constitutes an important exception to this rule, as several demolinguistic projection models have been developed over the years, thanks to the availability of abundant language data in census and surveys alike. Canada’s interest in language issues has deep roots in its demography and its peculiar history: its official languages – English and French – were put at the core of its constitution, its political symbolism and its mythology1. The sustainability of the French language is also a major preoccupation in Québec, the only province with a francophone majority in Canada.
Canada may be regarded as a natural experiment in language dynamics. The country is officially bilingual at the federal level (French and English), but mainly monolingual at the provincial level with only one province (New-Brunswick) being officially bilingual2. Demographically, French speakers constitute the majority only in Québec, which is the second largest province in Canada with an estimated population of 8 million. This geographical distribution gives an English majority in Canada outside of Québec, and a French majority in Québec, with linguistic minorities interspersed across the country. French minorities outside Québec strive in wide variety of “institutional completeness” contexts (Breton, 1964), French institutions often being non-existent or fragile. In contrast, the English minorities in Québec are in a relatively privileged situation, as they are geographically concentrated in the Montréal urban center where they benefit from a rich institutional setting (schools, universities, hospitals, media, etc.) and readily available governmental services in English.
Demographically, Canada is well settled in a low-fertility, rapid-ageing and high-immigration regime3. The high influx of immigration continuously modifies the country’s demographic and linguistic landscape, impacting on the relative size of official language populations as most immigrants to Canada typically integrate to the English community. In the past, the high fertility of the French Canadians prevented a rapid decline of their percentage of the total population that would have been induced by the higher proportion of English speakers among immigrants. Nowadays, however, fertility is low among both English and French Canadians, and about two thirds of the Canadian population growth is due to an increasingly diverse immigration. Between 2001 and 2006, Canada's foreign-born population increased by 14% – four times faster than the growth rate of the Canadian-born population during the same period – and most immigrants have a mother tongue that is neither English nor French. Consequently the share of the Allophone population – those having a non-official language as a mother tongue – is growing rapidly: from 18% in 2001 to 20% in 2006. At the same time, French communities in Canada face an important assimilation pressure: nearly half of those living outside Québec speak predominantly English in their home (Marmen & Corbeil, 2004).
Most immigrant Allophones living in Canada outside Québec will eventually learn and speak English as their usual language, but very few will learn French. In Québec, the linguistic choice of immigrants is not so one-sided, as French and English are relatively strong in the Montréal area where most immigrants settle. The relative strength of English in a predominantly French environment may be explained by the geographical concentration of its speakers, its majority position in the rest of Canada (and North America), its prestigious and well established institutions in Québec (education, health care, community, etc.) and its attractiveness and status as a global language.
There have been several attempts to control the impact of immigration on the country’s language composition. Québec has had a long history of language management policies, ranging from Bill 101 – regulating language practices in public and institutional settings – to immigration policies explicitly designed through a point system to favour immigrants able to speak French. On the federal side, Citizenship and Immigration Canada has recently created a program that favours French speaking immigration in provinces other than Québec in order to revitalize declining French communities. Although it is too soon to assess its success, this Canadian policy may be cited as the most recent initiative underlining federal efforts to sustain the demographic weight of official language communities in Canada.
Historically, most attempts at demolinguistic projections in Québec have used the traditional cohort-components population projection models (Termote, Payeur, & Thibault, 2011; Termote & Thibault, 2008). Those projections focused on a single language variable – language spoken most often at home – and did not make full use of available variables such as the mother tongue, the immigrant generation status or the age at immigration, all of which are important variables in determining the risk of making a language shift (i.e. starting to speak at home a language that is different from one’s mother tongue).
More recently, a microsimulation model called Demosim (Bélanger & Caron Malenfant, 2005; Caron Malenfant, Lebel, & Martel, 2010) was used to project several dimensions of the ethnocultural composition of the future Canadian population, including the mother tongue. Unfortunately, Demosim does not include the language most often spoken at home, a variable that may be considered a more informative measure of actual linguistic behaviour and integration. Moreover, published results aggregate both official languages in a single category so that monitoring of the evolution of French and English separately is rendered impossible.
Linguistic projection models thus still require development and microsimulation should be the preferred tool to realise them.
First, microsimulation allows for explicit consideration of all important factors driving the future linguistic composition of the Canadian population. Fertility and internal migration differentials by language characteristics or duration of residence in Canada can be easily implemented. Some events such as the probability of intragenerational language shift in home language given the duration of residence can hardly, if at all, be modeled in a multi-state model, whereas they are relatively easily included with microsimulation (Van Imhoff & Post, 1998). Intergenerational language shifts (mother tongue) are easily implemented by using an origin-destination matrix between the mother’s mother tongue and the child’s mother tongue at birth. Language dynamics are complex phenomena and are best modeled using microsimulation.
Second, microsimulation is better able to project multiple dimensions of the population’s language profile. The model we present in this paper includes mother tongue and language used most often at home, but may be expanded to project other linguistic variables such as knowledge of official languages or language most often used in the workplace.
Third, since most policy-relevant variables are included in the model, microsimulation is better suited to the creation of scenarios that can illustrate the potential effects of policy changes. The model may be easily parameterised to realise virtual social experiments.
The main objective of this paper is to present a Modgen-based dynamic microsimulation population projection model depicting the impact of different immigration and integration policies on the linguistic composition of Québec and Canada. The model allows for scenario building in order to investigate potential impacts of changes in differential demographic behaviours such as fertility, internal migration, and more importantly, given its importance as a component of population growth, changes in the linguistic make-up of immigration. Linguistic composition of the future Canadian population will be projected up to 2051 for different scenarios. Populations whose demographic parameters remain constant for a long time become “stable” in the sense that their global characteristics (age/sex structure, linguistic composition, etc.) stop changing, even though growth rate might still be non-zero. To see where populations tend to converge in the long run, stable populations are also derived for all scenarios.
2. Methods
The microsimulation model presented in this paper is called Hermès in honour of the Greek god of communication and commerce. Hermès is a dynamic, open, continuous-time, case-based model created using the Modgen generic microsimulation programming language (itself based on C++). Modgen was developed by Statistics Canada and the software package is available for free on the agency’s web site.
Modgen models are based on competing events that, when they occur, change the characteristics of actors. Each event is attributed a specific time function and a corresponding action function. The time function computes the duration (in continuous time) required before the occurrence of an event. The action function specifies the modifications that must be made to the actor’s characteristics once an event has occurred (in the simple case of mortality, changing the actor status from alive to dead, for instance). Modgen automatically takes care of the event loop to make simulation time progress in undefined steps, jumping from one item to the next in the event queue. Modgen automatically recalculates time-to-event if any characteristic determining the risk of a specific event changes throughout the simulation. As an example, time until death is recalculated at every anniversary and every January 1st, as input death rates vary according to age and calendar year.
Modules simulating relevant demographic events are described in the sections below: language, fertility, mortality, internal migration, international immigration and emigration. As language is the central component of the model, the language module is presented first.
2.1 Language module
2.1.1 Definitions
Because language dynamics are complex and multifaceted, terminology must be precisely defined. The next few paragraphs aim at clarifying the concepts used throughout this paper.
The mother tongue refers to “the first language learned at home in childhood and still understood by the person” at the time the data was collected.4 An individual having French or English as his/her mother tongue will be referred to as a Francophone or an Anglophone, respectively. Individuals having a non-official language as their mother tongue will be denoted as Allophones. The home language is defined as the language most often spoken at home. Individuals using a language X at home will be called “speakers” or “users” of X.
Language characteristics may change in two different ways. First, a mother may fail to transmit her own mother tongue to her children. This will be called an intergenerational language shift. Intergenerational language shifts are most common for children born in linguistically mixed unions. Second, an individual may predominantly use at home a language that is different from his/her mother tongue. This is called an intragenerational language shift and is most likely to occur before the age of 30.
For immigrants who have already made an intragenerational language shift, the language used at home is usually the dominant language of the host country. In Canada outside Québec, this language is English for most if not all immigrants. The situation is more ambiguous in Québec where French and English are codominant languages. Historically, immigrants in Québec have switched to French or English depending on the social and legal context, as well as on their ethnocultural characteristics. For example, Allophones having a Latin language as a mother tongue are more prone to use French at home rather than English. Hence, individuals having a Latin mother tongue, or a mother tongue that is spoken in former French colonies, will be called Francotropes (Castonguay, 1994; Chiswick & Miller, 1994). Conversely, individuals having a Germanic mother tongue, or a mother tongue that is spoken in former British colonies, will be called Anglotropes. Some Allophones, such as Chinese for example, may be neither Francotrope nor Anglotrope and are thus randomly assigned to one of the two categories. Note that this subcategorization is contextual and is a reflection of a reality that only prevails in Québec: all immigrants outside Québec tend to adopt English, regardless of their mother tongue or their country of origin.
The census questionnaire does not solicit but captures multiple declarations to questions related to language. As such, a person may declare having two mother tongues or speaking most often at home more than one languages. Such multiple declarations were simplified by randomly retaining one of the indicated languages and dropping the other(s). Multiple declarations amount to 1.3% of the population for mother tongue (5% if only considering Allophones) and 1.8% for language most often spoken at home (12% if only considering speakers of non-official languages). There exist various methods of treating multiple declarations, all of which slightly affect language shift rates and orientation. The method used here was shown to be a robust and acceptable analytic middle ground (Sabourin & Bélanger, Forthcoming).
2.1.2 Mother tongue and intergenerational language shift
The mother tongue of an actor can take one of four values: French, English, Other-Anglotropes, Other-Francotropes. In the model, this characteristic is set at birth, and does not change afterwards. When an actor is born in the model, his or her mother tongue can be different from his or her mother’s mother tongue. These intergenerational language shifts are set to depend on the mother’s mother tongue, her home language, her region of residence and her immigration status. Even though both the mother and the father may exert an influence on the child’s mother tongue, only the mother’s mother tongue is used in the model. This is due to the fact that the model does not include a matrimonial market: births in the model are not linked to a specific father, hence the father’s mother tongue is unknown. Nevertheless, part of the father effect is indeed captured in the origin-destination matrix, as some of the mothers used to construct the matrix are part of a linguistically exogamous union.5 The transition matrices are derived from census data by comparing the child’s mother tongue to the mother’s mother tongue. Table 1 below shows an example of such an intergenerational mother tongue transition matrix. Language shifts occur away from the diagonal.
Example of a transition matrix for intergenerational mother tongue transmission, immigrant mothers speaking French most often at home, Québec (2006 census). Category “Others” includes Anglotropes and Francotropes.
| Mother’s mother tongue | ||||
|---|---|---|---|---|
| English | French | Others | ||
| Child’s mother tongue | English | 16% | 2% | 2% |
| French | 84% | 98% | 74% | |
| Others | 0% | 0% | 24% | |
| 100% | 100% | 100% | ||
As can be seen from the table, despite the fact that the mother’s main language at home is French, this language is not always declared as the mother tongue of the child. For instance, 16% of Anglophone and 24% of Allophone mothers still transmit their own mother tongue to their children, even though they speak French most often at home. In other words, the children’s mother tongue does not always reflect the language most often spoken by the mother, thus the need for such a transition matrix.
2.1.3 Home language and intragenerational language shift
Home language can take one of three values: French, English or Other. At birth, an actor’s home language is set to be equal to its mother tongue and thus, as we have seen, it can be different from the parents’ home language. During a simulation, an actor may change its main language at home, thus performing an intragenerational language shift. In real life, language shifts may occur for different reasons, for instance when siblings start using together the language of schooling (Spolsky, 2009), or when young adults leave the family household to live with friends or settle in a linguistically exogamous union (Bélanger et al., 2011).
Intragenerational language shifts are modeled in two separate steps: first, the duration before the occurrence of a language shift is computed. Next, once a language shift has occurred, the home language is modified according to a “mother tongue to home language” origin-destination matrix.
Unfortunately, no longitudinal data exists to estimate the age-specific probabilities of intragenerational language shifts. We derived the probability of language shift from cross-sectional data using a method described elsewhere (Sabourin & Bélanger, Forthcoming). Briefly, we plotted the percentage of individuals still speaking their mother tongue at home against their age, or, in the case of immigrants, against the number of years since arrival to Canada and age at arrival. The resulting fitted curves (second-order polynomials) were treated as regular survival curves and implemented in the model. Comparison of data obtained from four censuses shows that the language shift process appears relatively stationary. Figure 1 below shows examples of the “persistency” (percentage of individuals still using their mother tongue as their main language at home) of Canadian-born Allophones (Figure 1A) and immigrant Allophones (Figure 1B). Persistency curves vary according to region of residence, mother tongue, immigration status and age at immigration. The annual probability of intragenerational language shift is derived from these curves. No language shift may occur after the age of 50 years old.

Percentage of individuals still using their mother tongue as the language most often spoken at home (Persistency) with respect to (A) age for Canadian-born Allophones, and (B) length of stay in Canada and age at immigration for immigrant Allophones (1991, 1996, 2001 and 2006 censuses).
When a language shift occurs, the model attributes a new home language to the actor according to its characteristics: mother tongue, immigrant status and, for Allophones in Québec, the affinity, or “tropism”, to English or French.
Although many language shifts are theoretically possible in the course of a lifetime, only one shift is allowed in the model. This choice is explained by the fact that multiple language shifts are probably not very common and that no data set would allow us to appropriately model them. Moreover, language survival curves as shown in Figure 1 don’t distinguish the rank of a language shift (first or subsequent). Hence, language shift rates derived from these language survival curves may be considered as “net” rates. In any case, the “one shift” constraint should not have a significant impact on the results. Table 2 below shows the transition matrix for Canadian-born individuals living in Québec.
Example of a transition matrix for intragenerational language shifts, individuals aged less than forty and born in Canada, Québec (2006 census).
| Mother tongue | |||||
|---|---|---|---|---|---|
| English | French | Others – A | Others – F | ||
| Home language | English | – | 81% | 84% | 20% |
| French | 89% | – | 16% | 80% | |
| Others | 11% | 19% | – | – | |
| 100% | 100% | 100% | 100% | ||
2.2 Fertility
Age-specific fertility rates according to region of residence and language spoken at home are derived from the 2006 census using the own-child method (Cho, Retherford, & Choe, 1986, Desplanques, 1993). Overall fertility levels are then calibrated so that the model matches the number of births observed in the provincial vital statistics of 2011. Total fertility rates according to the 2006 census were 1.66 for Canada as a whole, 1.60 for English speaking mothers, 1.54 for French speaking mothers and 2.00 for mothers speaking a non-official language.
2.3 Mortality
Age-specific mortality rates vary according to sex, province of residence and calendar year and are derived from vital statistics. Mortality rates and their projected values up to 2051 were provided by Statistics Canada. Life expectancy at birth for Canada is 82.9 years for females and 78.2 years for males in 2007. It is 88.8 years for females and 85.9 for males in 2051.
Life expectancy is known to vary slightly according to language (Auger, Harper, Barry, Trempe, & Daniel, 2012) or immigrant status (Ali, McDermott, & Gravel, 2004), but differentials are not included in the projections as reliable data on age-specific death rates for these specific subpopulations is not available. Moreover, past trends are not likely to be representative of future trends, and slight variations in life expectancy should have little impact on the projection results.
2.4 Geography and internal migration
The model divides Canada in 13 linguistically relevant regions, but for the sake of simplicity and in the interest of an international audience, results presented in this paper will be restricted to the province of Québec and the rest of Canada.
An annual probability of exit is obtained for each region by running a logistic regression of one year mobility against age, sex, language used at home and immigrant status (2006 census). Language is a strong determinant of mobility for Non Francophones in Québec and for Francophones outside Québec (Newbold, 1996; Termote et al., 2011).
After the occurrence of an internal migration event, a destination region is found using an origin- destination matrix derived from the 2006 census data. The origin-destination matrix is allowed to vary according to the language used at home and the immigrant status.
2.5 International immigration
The model is open to immigration, an important component of population change in Canada and undoubtedly the most important driving factor in the transformation of the Canadian cultural and linguistic composition.
Characteristics of arriving cohorts of immigrants in the model are taken from the characteristics of recent immigrants in the 2006 census (arrived between 2000 and 2006). Table 3 shows that immigration is mostly concentrated in three provinces (Ontario, British-Columbia, and Québec) and in large cities (70% of immigrants in Québec are settled on the Montréal Island).6
Geographical distribution of immigrants arrived in Canada between 2000 and 2006 (2006 census).
| Region | % of total immigration |
|---|---|
| Atlantic provinces | 1.2% |
| Ontario | 53.7% |
| Prairies | 12.7% |
| British Columbia | 15.8% |
| Québec | 16.7% |
| Montréal Island | 69.9% |
| Rest of Québec | 30.1% |
In the model, the proportion of immigrants settling in Québec was set to 20% instead of 16.7%. This decision reflects the fact that upon arrival, close to 20% of immigrants choose to establish themselves in Québec: this percentage decreases through time due to negative net internal migration for immigrants. The choice to set the proportion of immigrants at 20% also reflects recent successful government efforts to attract an increasing proportion of Canadian immigration in Québec. According to the most recent entry statistics, Quebec has been the province of destination of 20% of the immigrants settling in Canada over the most recent 5 year period (2009–2013).7
Linguistic composition of immigration settling in Québec is very different than in the rest of Canada, as the provincial government has the power to select part of its immigrants according to a selection grid which includes points for knowledge of French.8 Table 4 below shows the linguistic distribution of recent immigration in Québec and in the rest of Canada.
Distribution of immigrants arrived between 2000 and 2006 according to mother tongue (2006 census).
| Canada outside Québec | Québec | |
|---|---|---|
| English | 16.4% | 4.8% |
| French | 1.0% | 19.8% |
| Others-English | 82.6% | 24.3% |
| Others-French | N/A | 51.1% |
The user of the model is able to modify the number of immigrants as well as their geographical and linguistic (mother tongue) distribution, thus allowing for the creation of different scenarios related to the intensity, the distribution and the composition of immigration. This is achieved through the absolute (for intensity) and relative (distribution and composition) adjustment of immigrant weights in the model.
2.6 Emigration
Exit rates are taken from Statistics Canada and vary according to region of residence, sex and age. A relative risk is inserted so that recent immigrants are more likely to emigrate than natives, reflecting the fact that a significant proportion of emigration consists of return migration (Termote et al., 2011). As there are no population registers in Canada, emigration data is rather unreliable and approximate. This should not be an important shortcoming, however, as variations in parameter values don’t significantly alter the results.
The proportion of immigrant leaving Canada shortly after arrival was obtained by comparing the number of received immigrants between 1996–2001 according to Citizenship and immigration Canada, and the number of immigrants from this cohort as measured by the 2006 census, yielding a retention rate of 85%. Relative risk of emigration for recent immigrants in the model was adjusted so that 85% of immigrants arrived between 2006 and 2011 (in the simulation) were still present in 2016. After calibration, recent immigrants were about 25 times more likely than natives to emigrate.
2.7 Base population
The base population is derived from the confidential microdata file of the 2006 census and includes 6.8 million cases.
3. Hypotheses and scenarios
Hypotheses and scenarios focus on variables having a direct impact on language dynamics in Canada, such as composition of immigration and language management policies. Mortality, fertility and mobility are thus held constant across all scenarios.
The base scenario is constructed on recent trends for all characteristics and demographic events, that is, for Canada as a whole: a total fertility rate of 1.66; a life expectancy of 78 years for men (86 at the end of the simulation) and 83 years for women (89 at the end of the simulation); the internal mobility rates observed from 2005 to 2006; an annual international immigration intake of 2,50,000 (with characteristics of immigrants arrived between 2000 and 2006); and language choices (for intragenerational language shift) of immigrants arrived between 1986 to 2006.
Two scenarios focus on the global impact of immigration: the first increases immigration volume by 20% (300,000 immigrants, total) while the other decreases it by 20% (200,000 immigrants, total). Those scenarios constitute plausible hypotheses as immigration in Canada has gone as high as 280,700 and as low as 221,300 since the year 2000.
Since language choice of first- and second-generation Allophone immigrants is an important issue in Québec, scenarios modifying language shift behaviour and language composition of immigration are also implemented. Two scenarios apply language preferences of Anglotropes (“Others-Eng”) or Francotropes (“Others-Fr”) to all Allophones. These scenarios are obviously unrealistic because overnight changes in language preferences are sociologically unlikely. Nevertheless, they still provide a useful range of possible outcomes under different language shift regimes. Before language management legislations were first adopted in Québec in the 70s, language choices of immigrants were in fact close to the Others-Eng scenario.
Two more scenarios hold language preferences constant while modifying the linguistic composition of immigration. The language composition of immigration is modified so that the proportion of Anglotropes or immigrants having English as a mother tongue are doubled or halved. These scenarios help to investigate the impact of the immigration selection policy. Recently, the Québec government modified the selection grid in order to favor French and Francotrope immigrants. For an economic immigrant, an intermediate level of French is now required to receive any point for French proficiency.
Scenarios affecting language behaviour and language composition are similar in the sense that they modify the relative importance of Francophones, Anglophones as well as Francotropes and Anglotropes in the population. Scenarios affecting behaviour, however, have a more immediate effect as they modify the behaviour of incoming immigrant Allophones as well as the behaviour of Allophones already present in the population.
One more scenario is used to examine the impact of an increase in French immigration in Canada outside of Québec. This scenario investigates the possible long-term impact of a policy that is being implemented by Citizenship and Immigration Canada in order to linguistically revitalize French communities living in minority contexts.9
Finally, a control scenario investigates the impact of a 20% decrease in language shift intensity. This rather unlikely scenario investigates the possibility that the incentives to learn the host country language and the likelihood to form linguistically exogamous unions would decrease as the proportion of immigrants increases, thus decreasing the rate of language shifts.
A summary of all scenarios is presented in Table 5 below.
Summary of all scenarios.
| Scenario | Immigration volume | Linguistic composition of immigration | Language shift |
|---|---|---|---|
| Base | 250.000 | Recent | Recent |
| Imm+ | 300.000 | Recent | Recent |
| Imm- | 200.000 | Recent | Recent |
| ImmFr | 250.000 | 50% less Anglophones and Others- Eng in Qc Recent trend in the rest of Canada | Recent |
| ImmEn | 250.000 | 50% more Anglophones and Others- Eng in Qc Recent trend in the rest of Canada | Recent |
| ShiftFr | 250.000 | Recent | All Allophones in Qc shift like Others-Fr Recent trends in the rest of Canada |
| ShiftEn | 250.000 | Recent | All Allophones in Qc shift like Others-Eng Recent trends in the rest of Canada |
| CanadaFr | 250.000 | Recent trend in Qc Number of Francophone immigrants doubled in the rest ofCanada | Recent |
| Shift- | 250.000 | Recent | Language shift intensity is reduced by 20% |
4. Results
The composition of the Canadian population according to mother tongue and language spoken most often at home is presented. Results are shown for the province of Québec as well as for the rest of Canada. This subdivision in two regions is relevant as Québec is the only province with a Francophone majority. Moreover, Québec is the only region where official languages are effectively competing as a language of integration for immigrants in both the public and the private spheres.
This grouping should not suggest, however, that these regions are linguistically homogeneous. In Canada, the largest groups of Francophones outside Québec are located in Ottawa, in the north of Ontario and in the north of New-Brunswick, whereas Anglophones in Québec are concentrated in the region of Montréal. Sociolinguistic conditions vary widely from one region to another and affect behaviours such as internal migrations or language shifts. These regional differentials are explicitly taken into consideration in the model. That being said, a closer study of subregion dynamics is beyond the scope of this paper, whose aims are to present a new microsimulation model and to provide a broad overview of Canadian language dynamics
Figure 2 below shows the projection of the Canadian population up to 2051 with respect to mother tongue and language spoken at home (Base scenario), for Canada as a whole, for the province of Québec and for the other provinces (rest of Canada).
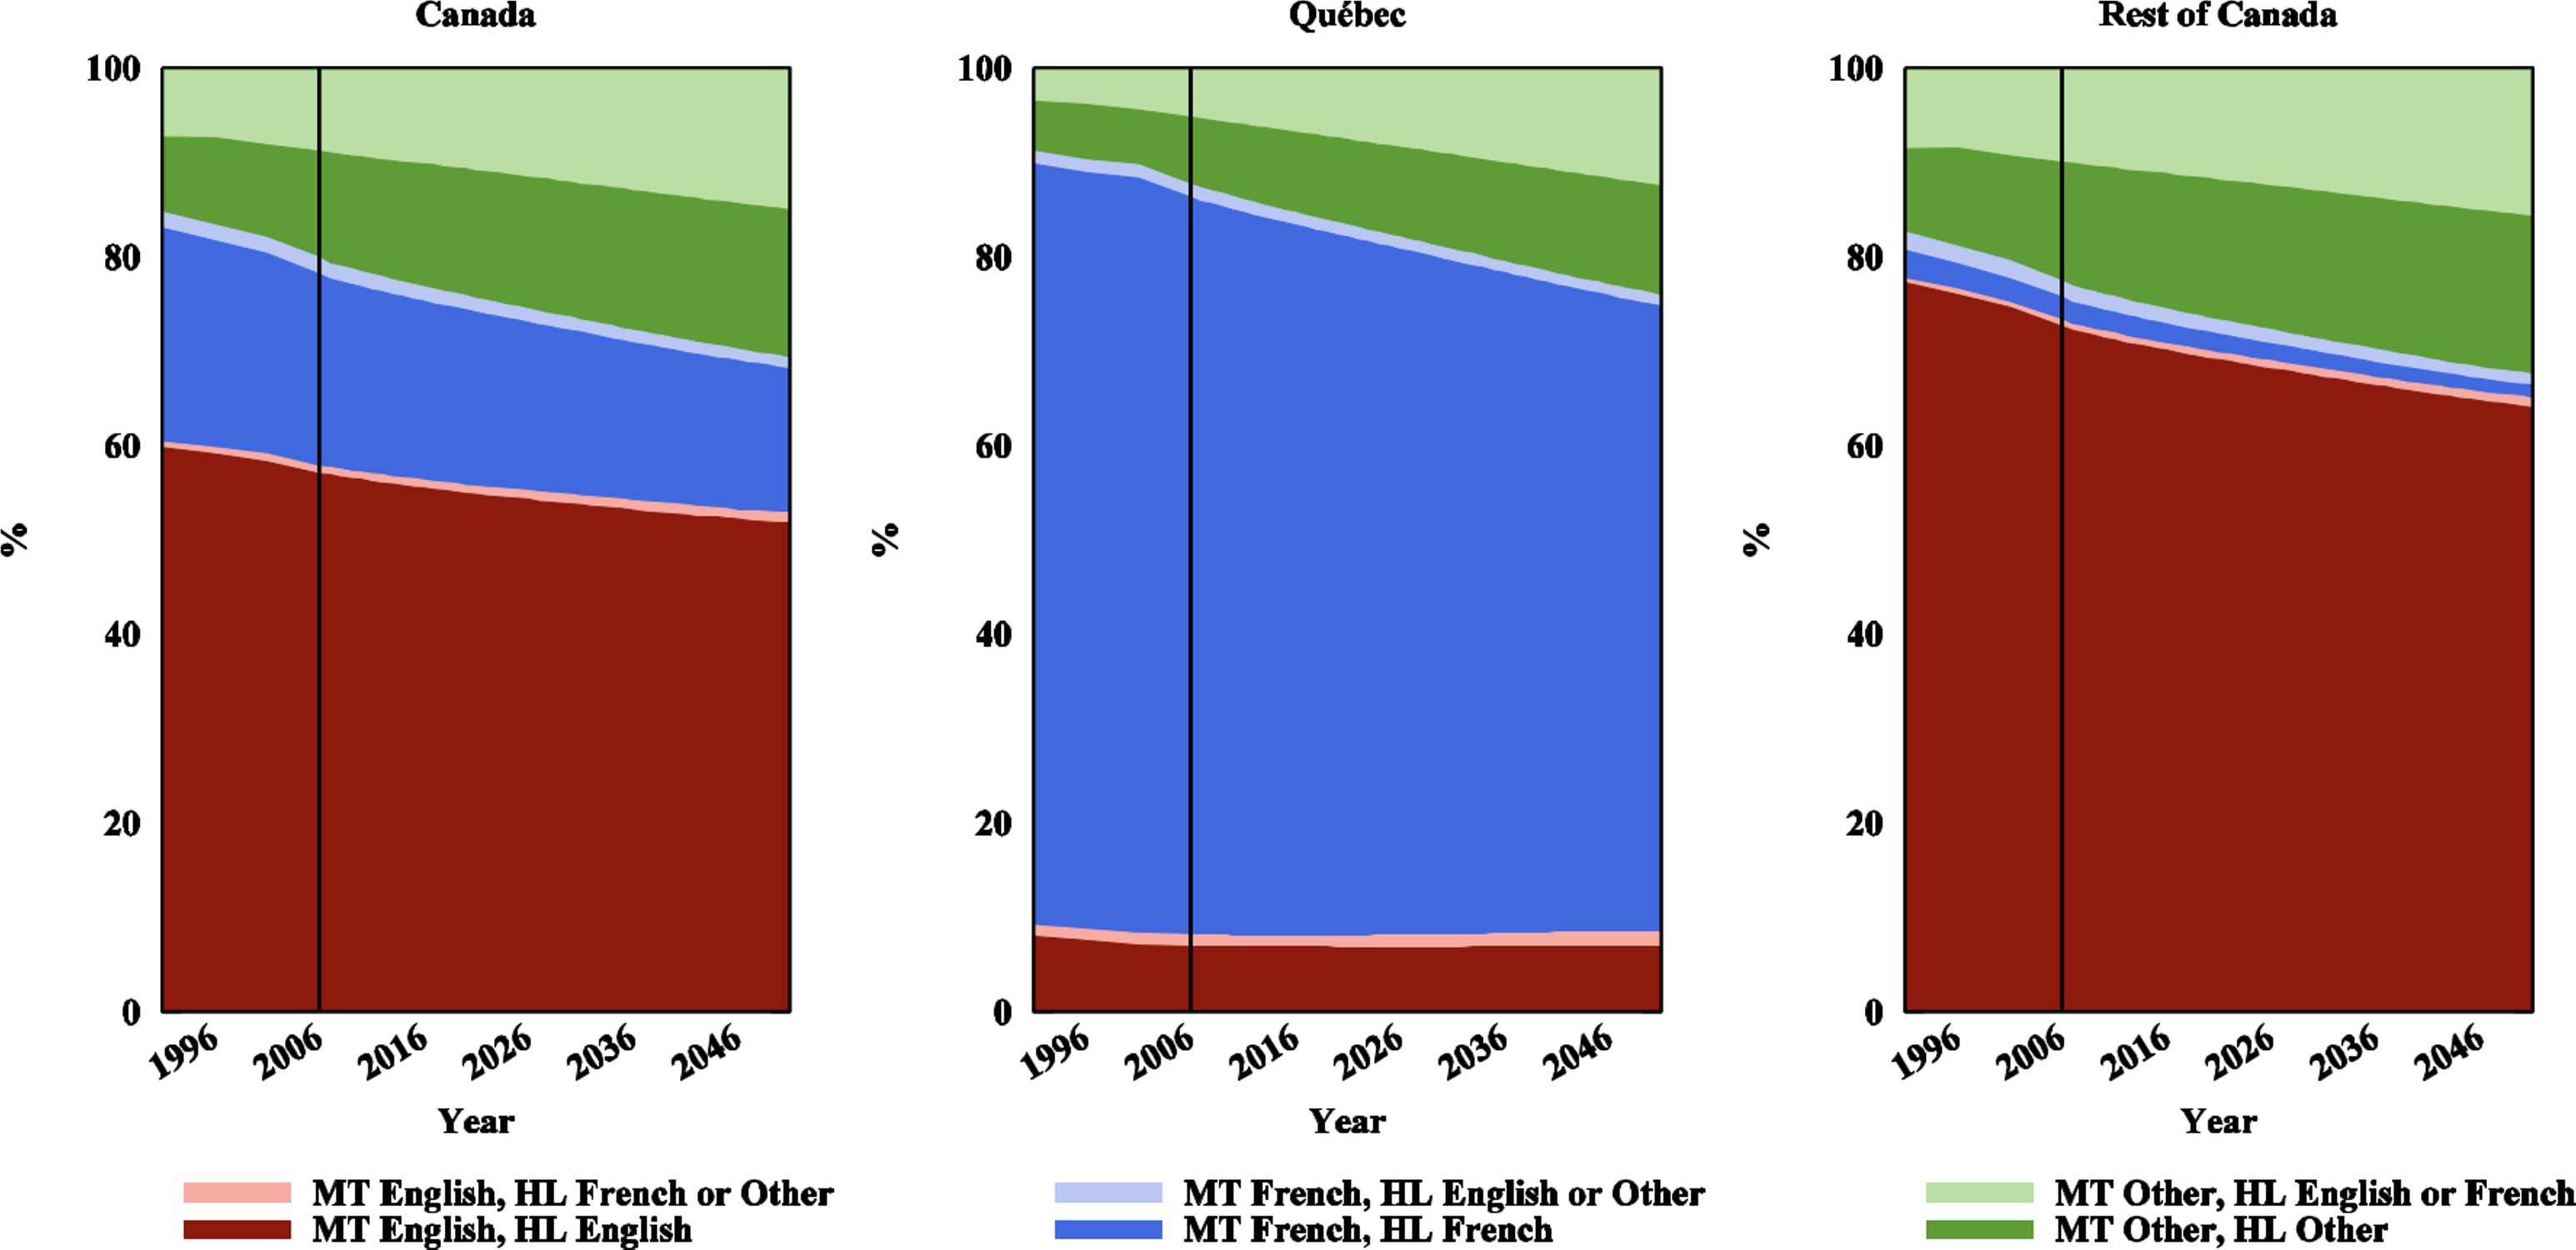
Linguistic composition of Canada as a whole (left panel), Québec (middle panel) and the rest of Canada (right panel), mother tongue (MT) and language spoken most often at home (HL). Light areas show the portion of a mother tongue group having performed a language shift. Census data for 1991 to 2006. Projection results for 2007–2051 (Base scenario).
Overall, projection results show an important increase in the Allophone population (i.e. the population whose mother tongue is neither English nor French). In Canada as a whole, the proportion of Allophones increases from 20% in 2006 to 31% in 2051. In terms of percentage points, the increase is similar in Québec (from 12% to 24%) and in the rest of Canada (from 23% to 33%). The relative increase is, however, much steeper in Québec, as the percentage of Allophones doubles in the course of the simulation. Historically, immigration has been much lower in Québec than in the rest of Canada, but rates have been converging in the last decade, thus explaining the rapid increase of the Allophone population observed in Québec. As a correlate to the growth of the Allophone population, a significant decrease in the relative importance of both official languages is also observed. Perhaps more interestingly, Figure 2 also shows that the proportion of Allophones speaking an official language at home also increases significantly, even a little faster than the Allophone population still speaking their mother tongue at home. This is due to the fact that second-generation immigrants, more likely to perform a language shift than first- generation immigrants, will comprise a growing portion of the Canadian population. Close to 90% of second-generation immigrants have performed a language shift by the age of 50. So if immigration does bring large changes in the mother tongue composition of the population, changes in the composition according to language spoken at home are not as large due to the dampening effect of language shifts. Moreover, some immigrants have performed a language shift even before or at their arrival in Canada, so the proportion of speakers of non-official languages in new immigration is lower than the proportion of Allophones. Indeed, census data shows that about 15 to 25% of immigrants having resided for less than six months in Canada declare a language most often spoken at home that is different from their mother tongue.
Official languages are not equally affected by the increase in the Allophone population. The Francophone population decreases at a faster rate in Québec (from 80% to 68%) than does the Anglophone population in the rest of Canada (from 73% to 65%). Also, the relative proportion of Anglophones with respect to Francophones is increasing in both regions: in Canada as a whole there were 2.6 Anglophones per Francophone in 2006 compared to 3.2 in 2051. This increase is due in part to intergenerational language shifts favouring English: growth rates from intergenerational language shifts are between two and three per thousand for Anglophones in Canada, around one per thousand for Francophones in Québec and negative two per thousand for French outside Québec. Another factor is the fact that Québec receives a share of immigration that is inferior to its demographic weight in the Canadian federation (20% of immigrants, but 23.5% of the Canadian population).
Official language minorities (Anglophones in Québec and Francophones in the rest of Canada) also follow different demographic trajectories. Whereas English as a mother tongue is stable in Québec (from 8.2% in 2006 to 8.5% in 2051), French decreases relatively sharply in the rest of Canada (from 4.1% in 2006 to 2.5% in 2051). The stability of English in Québec is in part explained by international immigration input as well as by intergenerational language shifts cancelling the negative net effect of other demographic factors.
Whereas mother tongue is thought to be a fixed characteristic of an individual, language spoken in the home might vary in the course of a lifetime. In the long run, third language speakers tend to adopt at home one of the two official languages in order to fully integrate to the host society, and the choice they make impacts on the demolinguistic composition of Canada. Heritage languages are seldom transmitted to descendants beyond one or two generations (Rumbaut, Massey & Bean, 2006; Turcotte, 2006; Bélanger, Sabourin & Lachapelle, 2010).
The impact of nine projection scenarios on the language spoken at home is presented in Figure 3. For all scenarios, vertical bars show the 2006–2051 variation in the demographic weight of English (red), French (blue) and Others (green) as languages most often spoken in the home. Additionally, stars show the variation between 2006 and the stable population.
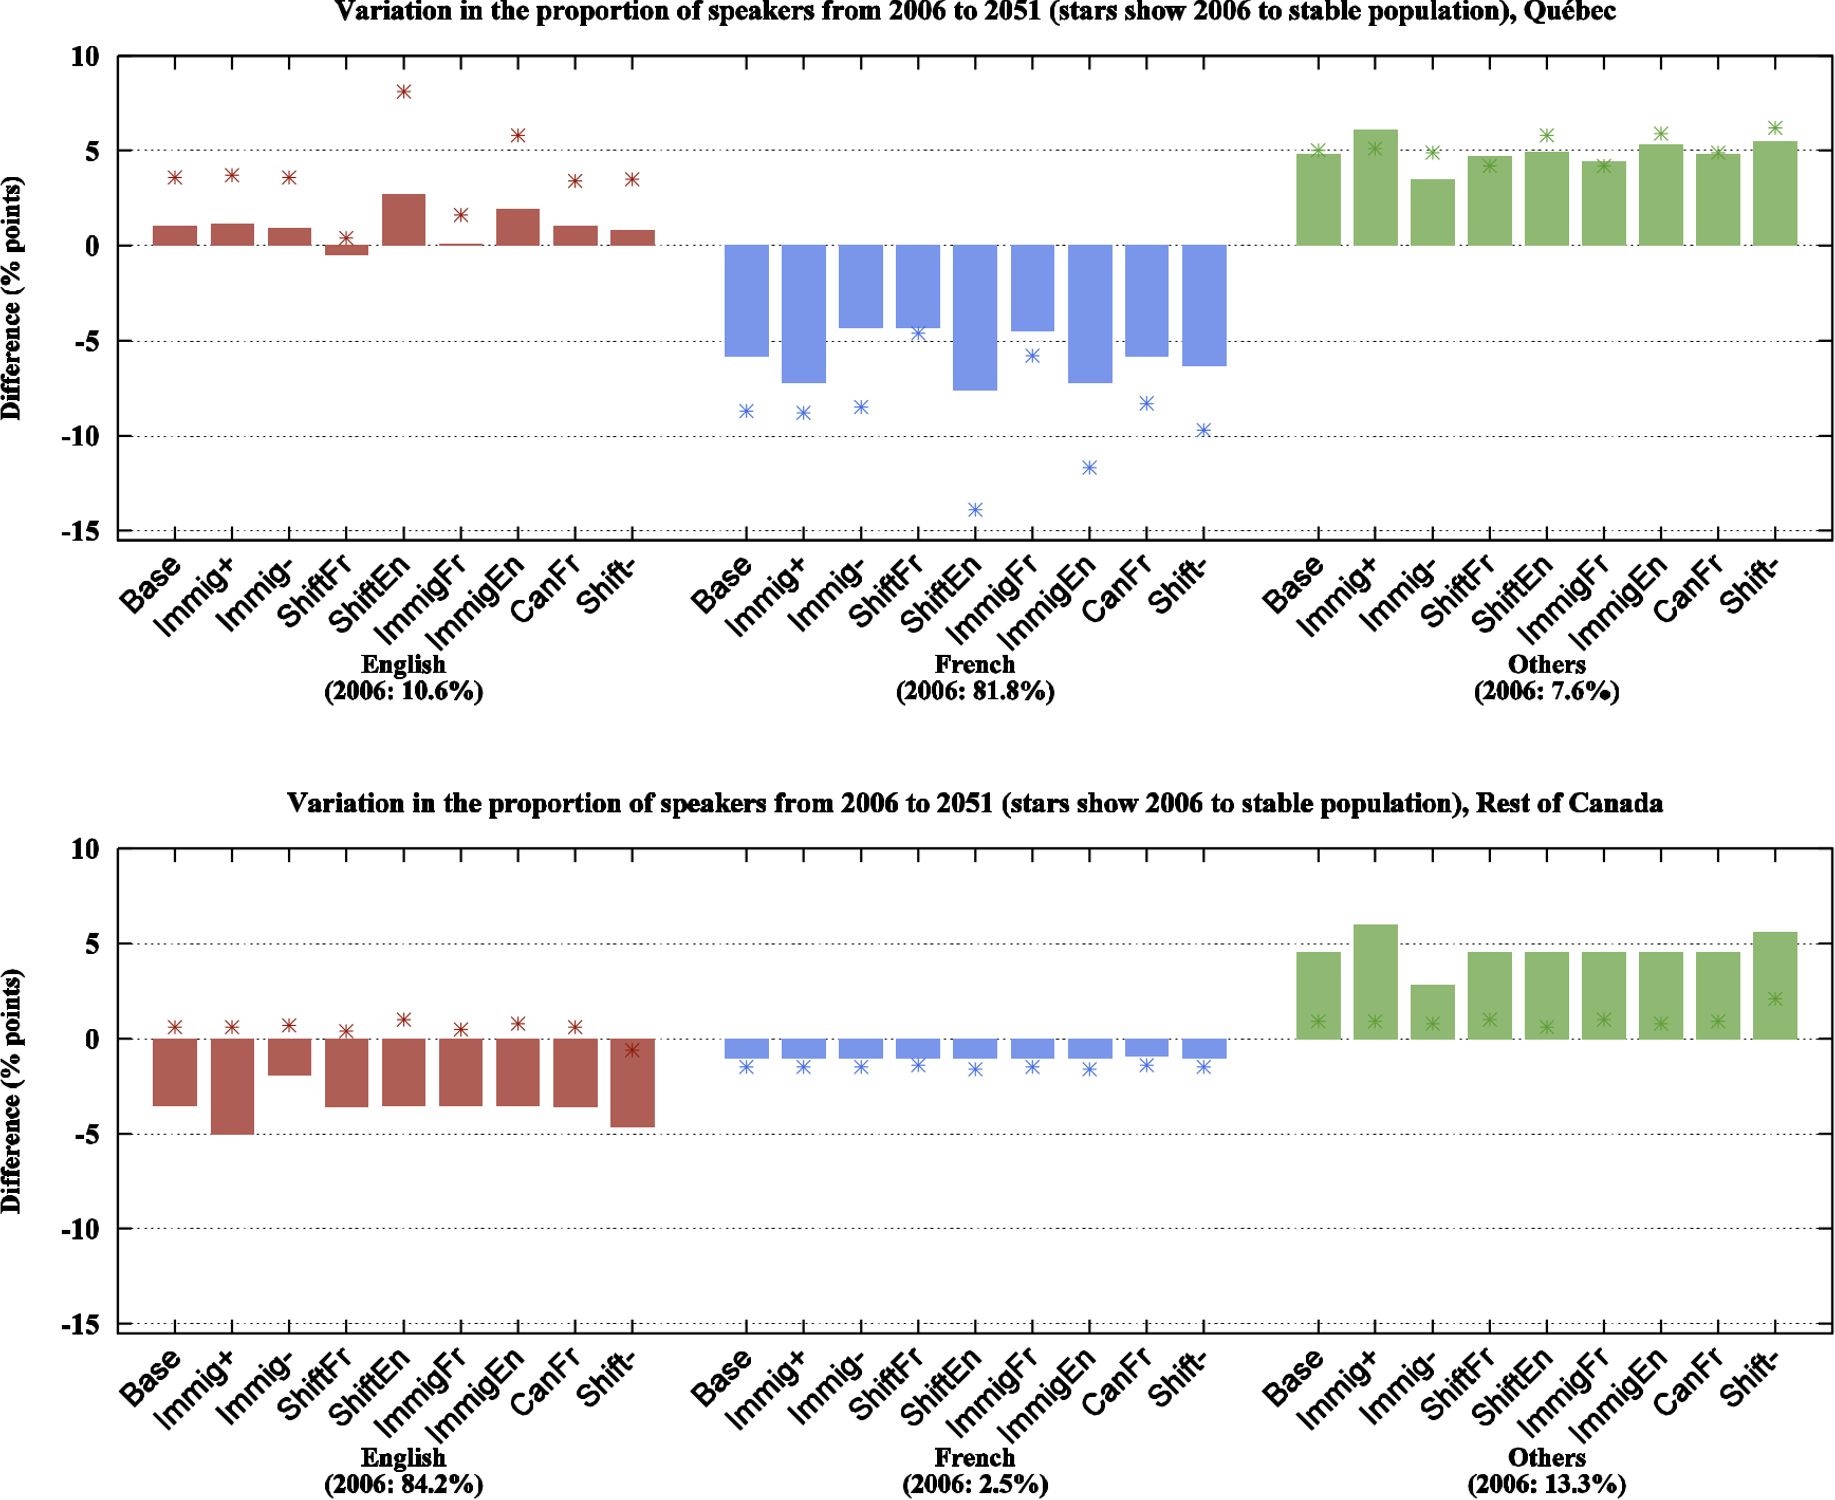
Variations in the linguistic composition of Québec (top panel) and of the rest of Canada (bottom panel) according to language spoken most often at home and projection scenario. English is shown in red, French in blue and other languages in green. Bars show variation from 2006 to 2051, stars show variation from 2006 to stable population. Census data for 2006. Projection results for 2051 and stable population.
The demolinguistic process under study can be treated as a markovian process and stable equivalent population distributions can be obtained by projecting constant assumptions regarding all components of change over a long period of time. Stable age structures are attained relatively rapidly in single region models, but stable distributions take longer to be reached in a multistate model. In this model, since several dimensions are at play (fertility, internal migration, immigration and emigration, language shifts and duration of residence in Canada for immigrants), a 400 year projection period was necessary to reach stable state. Of course, projections over such a long term cannot, and should not, be taken as anything near prediction of the future. Rather, the stable equivalent population distributions that result from this process should be regarded as a magnified portrait of the intrinsic demographic forces implied by the scenarios under study.
As expected, the variation in home language composition is not as steep as the variation in mother tongue composition. In the base scenario, the proportion of English in Québec (Figure 3, top panel) increases by one point up to 2051 (compared to 0.3 for mother tongue), French decreases by about 6 points (compared to 12 points for mother tongue) and other languages increase by 5 points (compared to 12 points for mother tongue). These slower variations are again due to the dampening impact of language shift «converting» speakers of non-official languages into speakers of an official language.
Overall, for all scenarios, the proportion of speakers of non-official languages increases while the proportion of French speakers decreases. The proportion of the English minority in Québec increases in all but one scenarios, whereas the demographic weight of the English majority in the rest of Canada decreases in all scenarios, although this decrease is less pronounced than it is for French in Québec.
Scenarios increasing or decreasing the intensity of immigration by 20% (immig+ and immig-) have a positive and negative impact, respectively, on the growth of the third language population. Conversely, the decline of French in Québec and English in the rest of Canada in 2051 is linked to the intensity of immigration: a more intense immigration leads to a larger decrease in the majority language population. Immigration intensity only marginally affects minority language speakers: English in Québec benefits from a small increase in both immigration scenarios whereas French in the rest of Canada declines in both scenarios. Interestingly, immigration intensity does not have an impact in the long run, as language composition in the stable population is the same for both high and low intensity scenarios, as well as for the base scenario. Moreover, in Canada outside Québec, the English population is relatively larger in the stable population than it is in 2051, and inversely for the third language population. This happens because as time passes and population increases, new immigration represents a lower and lower percentage of the total population. Additionally, second-generation immigrants, a group more prone to language shift than first- generation immigrants, grow in relative importance. In light of these results, it appears that Canada outside Québec had already reached the point of equilibrium of its linguistic composition in 2006 (under the assumptions of the projection, of course), and that the projected increase in the third language population over the 2006–2051 period is a transient phenomenon. The story is different in Québec where the third-language population was lower in 2006 than in the rest of Canada, and where language shifts benefit both French and English: stable population results show that in Québec, French continues to decrease and English continues to increase after 2051.
Scenarios affecting language shift in Québec (shiftFr favouring French and shiftEn favouring English) have a significant impact on the relative weight of official language speakers. Although both scenarios lead to a decrease in the proportion of French speakers in Québec, the scenario favouring English has a stronger effect (−7.6 point for French in ShiftEn as compared to −4.3 points in ShiftFr), especially in the very long run as can be seen from the stable population results (−13.9 points for French in ShiftEn compared to −4.6 in ShiftFr). The scenario ShiftEn corresponds to a situation that prevailed before the enactment of the first language laws in Québec. The situation has shifted in favour of French since then, so that the scenario ShiftFr is closer to today’s reality.
Scenarios modifying the linguistic composition of immigration in Québec (ImmigFr and ImmigEn) have similar effects to those modifying language shift preferences, although those effects have smaller amplitude. This is explained by the fact that language shift preferences scenarios (ShiftFr and ShiftEn) affect people already in Canada as well as future immigrants. Immigration composition has only an impact for future immigration, thus the smaller effect.
The four scenarios investigating the effect of Québec language policies have expectedly a marginal effect on the rest of the Canadian population. The small effects that are observed are mainly due to the redistribution of population through interprovincial migrations: more English in Québec means more migrations to the rest of Canada, as English speakers in this province have a bigger propensity to out-migrate than French speakers.
The scenario doubling the relative importance of Francophones in the rest of Canada (CanFr) has virtually no effect on the outcome of the projections. Higher Francophone immigration doesn’t seem to compensate for losses due to internal migrations, language shifts and declining natural growth. The percentage of French being already low in the rest of Canada, a decline of one percentage point corresponds to a reduction of more than a third of the initial share.
Finally, a scenario testing the impact of a decrease in language shift rates was tested. Some studies have shown that the concentration of speakers from the same language group may prevent their members from learning the majority language as they might have access to media in their own language and find spouses from their own linguistic group (Chiswick & Miller, 1996). The impact of this phenomenon seems to be marginal in Canada, at least at this geographic scale, where language shifts rates are relatively high, even in region with an important immigrant population (Bélanger et al., 2011, Rumbaut et al., 2006). As can be seen in Figure 3, a reduction of 20% in language shift rates did have an impact on the language composition of Canada, but the overall effect was not very important. So even a substantial slowdown in language shift would not lead to a major increase in the proportion of speakers of a non-official language.
In order to better understand the demographic forces driving the evolution of the linguistic composition of Canada, the components of growth for the three language groups in Québec and in the rest of Canada are shown in Figure 4 below.

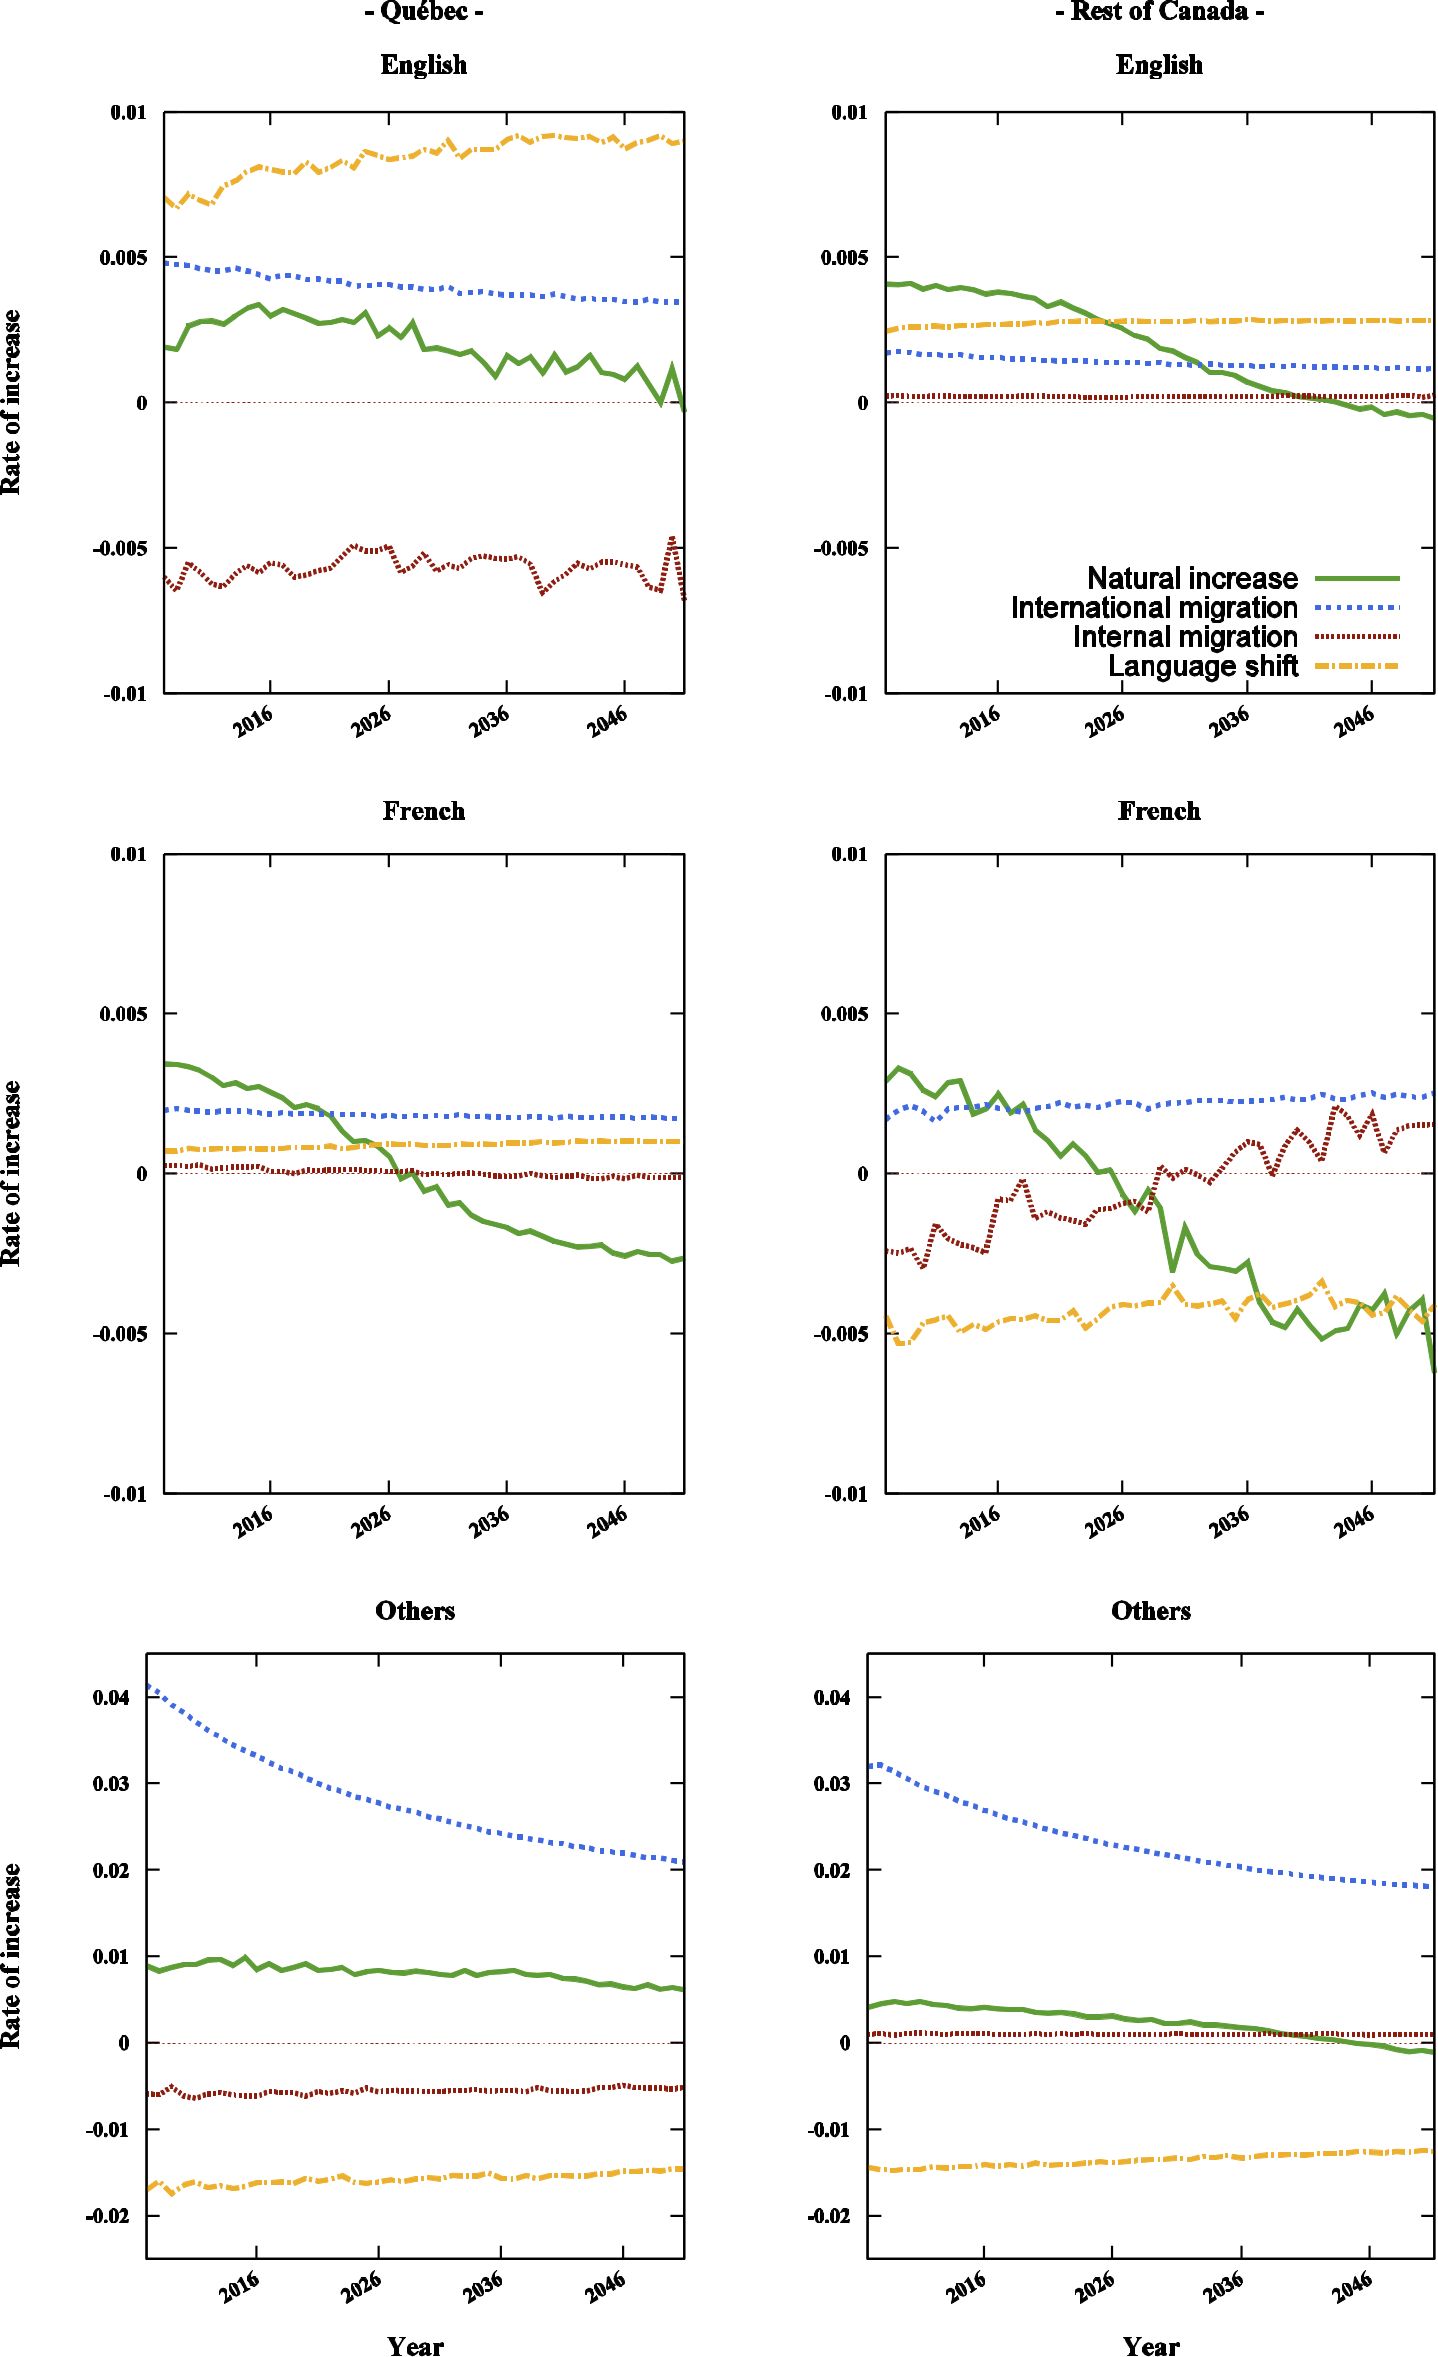
Components of growth for English speakers (first row), French speakers (second row) and third language speakers (third row), Québec (first column) and the rest of Canada (second column). Components of growth include rates of natural increase (mortality rate minus birth rate), international migration (immigration rate minus emigration rate), internal migration (inmigration rate minus outmigration rate) and net language shifts. Projection results from 2007 to 2051, Base scenario.
Comparing the majority groups in Québec (French) and in the rest of Canada (English), we find that growth from net internal migration is negligible in both regions and that growth from international immigration is small but significant. Natural increase is declining in both regions, although faster in the province of Québec where it becomes negative around 2025. Natural increase of English speakers in Canada outside Québec is significantly shifted up by intergenerational language shifts, as many non-Anglophone mothers give birth to children having English as a mother tongue. Since the model sets the initial home language to be equal to the mother tongue at birth, intergenerational language shifts boost the natural increase of English speakers. French in Québec doesn’t benefit as much from intergenerational language shifts because its immigrant population is smaller than in the rest of Canada, and also because the English minority attracts a significant portion of the intergenerational language shifts. Finally, both majority groups benefit from language shifts, although, again, the benefits are somewhat less important in Québec (less than half of what it is in the rest of Canada).
Sources of growth for the English minority in Québec and the French minority in the rest of Canada are more contrasted. In Québec, the only source of negative growth for the English minority comes from negative net internal migration. Natural increase (again, which includes intergenerational language shifts), international migrations and intragenerational language shifts are all sources of positive growth for English speakers throughout the projection, with language shift being the major source of growth. For French speakers in the rest of Canada, the main source of growth comes from international migrations. There is also growth from natural increase at the beginning of the projection, but the number of deaths starts exceeding the number of births around the year 2025. Language shift and internal migration are important sources of negative growth, although the latter becomes slightly positive around 2030. Overall, French speakers in Canada outside Québec suffer from negative growth.
International migrations are the main source of growth for speakers of non-official languages, as expected. Rates of increase due to international immigrations are important: over four percent in Québec and over three percent in the rest of Canada. These rates are declining as total population increases and as new immigration comprises a smaller and smaller share of the total population. While international immigration is an important source of positive growth, language shift is an important source of negative growth, with rates between −1.5% and −2%. It can also be seen that natural increase of third language speakers is more important in Québec than in the rest of Canada, where it has only a small impact. Conversely, internal migration has a significant negative impact for third language speakers in Québec and a negligible impact in the rest of Canada. Overall, language shifts and immigration constitute the main negative and positive driving forces for the third language population.
5. Discussion and conclusion
We have presented a microsimulation model projecting the composition of the Canadian population with respect to two language characteristics: mother tongue and language spoken at home. The former can be thought of as a marker of ethnic origin while the latter may be considered as an indicator of linguistic integration. The results were presented for Québec, the only province with a French-speaking majority, and the rest of Canada, in which English speakers form the majority. The projection scenarios used in this paper emphasized the effect of immigration level, linguistic composition of immigration and language shifts, all factors that can be influenced by changes in immigration selection or linguistic integration policies.
For mother tongue, the base scenario shows a strong increase in the Allophone population (non- official mother tongue) and a concurrent decrease in the official language population (French and English). The absolute increase in the Allophone population is similar in Québec and in the rest of Canada, but it is relatively more important in Québec as in this province the Allophone population was at a lower level in 2006. Figure 2 shows that even though the Allophone population is increasing fast, the Allophone population speaking an official language at home increases faster than the Allophone population speaking their own mother tongue at home (under the assumption of constant immigration).
Looking at language spoken most often at home, we find a general decline in French in all considered scenarios. English is increasing slightly in Québec and decreasing in the rest of Canada. The population of third language speakers obviously increases for all scenarios. The balance between official languages, the ratio of English speakers to French speakers, is increasing in favour of English for all scenarios, in both Québec and the rest of Canada.
All language groups suffered from a decline in their growth rate from natural increase, but the decline was fastest for French speakers. English speakers and French speakers in Québec benefited to different degree from positive growth due to language shifts. Speakers of non-official languages and French speakers in the rest of Canada suffered from negative growth due to language shift. All language groups benefited from net international migration, but results for internal migration varied according to language and regions. Non-French speakers in Québec have a higher propensity to out-migrate than French speakers, so speakers of a non-official language and English speakers had negative growth in this region due to internal migration. Internal migration had no significant effect on the growth of majority-language populations.
Stable populations were also derived for all scenarios and yielded interesting results. First, the intensity of immigration was shown to have no significant effect on the linguistic composition of the stable population: only the language composition of immigrants and the language shift regime have an impact. Second, in Canada outside Québec, under the assumption of constant immigration, the proportion of third language speakers is lower in the stable population than it is at the 2051 horizon. This shows that as population increases, language shift overcompensates for increases due to immigration. Had immigration intensity been set to evolve such as to be proportional to the total projected population, the population of third language speakers in the stable population would have been higher.
Overall, results of the projections show that immigration has a much larger impact on the linguistic equilibrium of a bilingual region like Québec than in a largely monolingual region like the rest of Canada. Competition between French and English in Québec adds further complexity to the projected language dynamics.
Globally and locally, French is declining in Canada, for both projected linguistic variables. In Canada outside Québec, French will over time represent a negligible portion of the population. This may lead to a difficult political situation as the demographic basis to maintain a nationwide policy of institutional bilingualism will get ever thinner. In Ontario, where the second largest population of French speakers is located, the dispersion and decrease of the minority population prompted the government to close the only French hospital in the province. The hospital was finally kept open after the Ontario Court of Appeal ruled in favour of the French communities, but this settlement came at the end of a judiciary fight that lasted for four years.
Increasing French immigration in Canada outside Québec doesn’t appear to be a suitable policy to maintain French vitality, at least country-wide. Decreasing natural increase, language shifts and internal migration counter the positive effect of an increasing international immigration of French speakers. Perhaps some specific regions where the French minority is more important can benefit from it. Further analysis might shed light on this important issue.
In Québec, even if French remains the majority official language, its majority status is weakened by the language choices of Allophones, particularly in scenarios where the proportion of Francophones or Francotropes among immigrants declines. Our scenarios demonstrate that the linguistic composition of future immigration and language preferences of immigrants, not immigration intensity, are the most important long-term factors reducing or increasing the rate of decline of French in Québec. This is placing Québec’s policy makers in a difficult situation. As Chiswick and Miller (1994) noted, a fully French speaking immigration might not be desirable, or even possible, given the limited number of potential international immigrants having French as a mother tongue and still speaking French at home. Limiting the immigration to French speakers might have a negative impact on the economic integration of newcomers and possibly also on productivity, especially if in doing so Québec has to change the composition of its immigration relative to factors that are positively related to economic integration, such as the level of education. On the other hand, the changing linguistic makeup of the province may have significant political and social consequences as well (Sabourin & Marois, 2014).
Recent political events seem to suggest that language policies favouring French in Québec won’t be reinforced, and that they might even get weakened. A recent attempt by a short-lived nationalist government to reinforce language laws in Québec was defeated in parliament. There is now increasing pressure on the government to reduce the importance of knowledge of French in the immigration selection grid in order to attract skilled labour proficient in English only. It will be interesting to see how the evolving policy context impacts on the demolinguistic future of Québec and Canada.
Footnotes
1.
See for instance: “The Next Act – A New Momentum for Canada’s Linguistic Duality”: http://publications.gc.ca/site/eng/244759/publication.html.
2.
Although Québec is officially monolingual French, institutionnal, geographical, political and economical factors favouring English make it the most bilingual province of the country.
3.
See Canadian demographics at a glance by Statistics Canada: http://www.statcan.gc.ca/pub/91-003-x2014001-eng.htm Consulted November 22nd 2014.
4.
If the person no longer understands the first language learned, the mother tongue is the second language learned. This definition is the one used by Statistics Canada.
5.
Addtionally, we could add that children living in stepfamily households are more likely to live with their biological mother than with their biological father, so the mother’s mother tongue is a more reliable predictor of a child’s mother tongue.
6.
The Montréal Island includes the city of Montréal as well as other municipalities.
7.
Citizenship and Immigration Canada (2013) Facts and figures. http://www.cic.gc.ca/english/resources/statistics/facts2013/index.asp. Consulted March 27th 2015.
8.
According to a federal-provincial agreement, the province of Québec has the power to select its economic immigrants according to its own criteria (this represents about two thirds of immigrants). The federal government still has jurisdiction over refugees, family reunion and some other immigrant classes.
9.
See: http://www.cic.gc.ca/english/resources/publications/settlement/framework-minorities.asp, consulted March 27th 2015.
References
-
1
Recent research on immigrant health from statistics Canada’s population surveys. Canadian journal of public healthRevue canadienne de santé publique, 95, 3.
-
2
Life expectancy gap between the Francophone majority and Anglophone minority of a Canadian populationEuropean journal of epidemiology 27:27–38.
-
3
Persistance et orientation linguistiques de divers groupes d’allophonesQuébec: Office québécois de la langue française.
-
4
Population projections of visible minority groups, Canada, provinces and regions, 2001–2017Statistics Canada.
-
5
The long language-ideological debate in BelgiumJournal of Multicultural Discourses 6:241–256.
-
6
Literacy and the labour market: Cognitive skills and immigrant earningsStatistics Canada.
-
7
Institutional completeness of ethnic communities and the personal relations of immigrantsAmerican Journal of Sociology 70:193–205.
-
8
Projections of the Diversity of the Canadian Population, 2006–2031Statistics Canada.
-
9
L’assimilation linguistique: mesure et évolution, 1971–1986Québec: Conseil de la langue française.
-
10
Language choice among immigrants in a multi-lingual destinationJournal of Population Economics 7:119–131.
-
11
Ethnic networks and language proficiency among immigrantsJournal of Population Economics 9:19–35.
-
12
Language skills and earnings among legalized aliensJournal of Population Economics 12:63–89.
-
13
Immigrant earnings: Language skills, linguistic concentrations and the business cycleJournal of Population Economics 15:31–57.
- 14
- 15
-
16
Mesurer les disparités de fécondité à l’aide du seul recensementMesurer les disparités de fécondité à l’aide du seul recensement, Population (French Edition), 2011–2024.
-
17
Through the Language Glass: Why the World Looks Different in Other LanguagesMetropolitan Books.
- 18
-
19
Reversing language shift: Theoretical and empirical foundations of assistance to threatened languagesMultilingual Matters Ltd.
-
20
Literacy and earnings: an investigation of the interaction of cognitive and unobserved skills in earnings generationLabour Economics 10:165–184.
-
21
Microsimulation methods for population projectionPopulation: An English Selection pp. 97–138.
- 22
-
23
The Ghettoization of Quebec: Interprovincial Migration and ItsDemographic EffectsCanadian Studies in Population 23:1–21.
-
24
Linguistic life expectancies: Immigrant language retention in Southern CaliforniaPopulation and Development Review 32:447–460.
-
25
La dynamique des substitutions linguistiques au CanadaLa dynamique des substitutions linguistiques au Canada, Population (INED), Forthcoming.
-
26
Indépendance: les conditions du renouveau59–94, Le projet d’une génération? Regard démographique sur l’avenir de l’indépendance, Indépendance: les conditions du renouveau.
-
27
Language management, Cambridge University PressLanguage management, Cambridge University Press.
-
28
Perspectives démolinguistiques du Québec et de la région de Montréal (2006–2056)Québec: Office québécois de la langue française.
-
29
Nouvelles perspectives démolinguistiques du Québec et de la région de Montréal, 2001–2051Québec: Office québécois de la langue française.
-
30
Overeducated immigrants in the Canadian labour market: Evidence from the workplace and employee surveyCanadian Public Policy 34:457–479.
Article and author information
Author details
Publication history
- Version of Record published: April 30, 2015 (version 1)
Copyright
© 2015, Sabourin and Bélanger
This article is distributed under the terms of the Creative Commons Attribution License, which permits unrestricted use and redistribution provided that the original author and source are credited.