Microsimulation model projecting small area populations using contextual variables: An application to the Montreal metropolitan area, 2006–2031
- INRS – Centre Urbanisation Culture Société, Canada
- Article
- Figures and data
-
Jump to
- Abstract
- 1. Introduction
- 2. Specific challenges of small area population projections
- 3. Modeling internal migration and residential location
- 4. Model definition, assumptions and data sources
- 5. Using the 2006–2011 period to validate and calibrate the model
- 6. Simulation 2011–2031
- 7. Conclusion
- Annex 1
- Footnotes
- References
- Article and author information
Abstract
A common difficulty faced when projecting small area populations has to do with the implementation of local factors which highly influence local population growth. This problem is particularly important when simulating events that have a strong geographic component, such as internal migration, and destination choice of external migrants. This paper is part of a larger research program that aims at developing a dynamic time-based microsimulation projection model of the population of the Montreal metropolitan area and its 79 municipalities, by age, sex, and language. It presents an innovative treatment of migration by taking into consideration previous changes in local conditions when determining mobility and destination choices. Municipalities are first divided into two categories, suburban and the central city, to compute location-specific probabilities of moving by age, language and place of birth. Then, the destination choice of movers is based on a utility function that accounts for five important determinants of residential choice: (1) the distance from the central city, (2) the current size of the population of each municipality, (3) the municipality development potential, (4) the linguistic composition of its population, and (5) the geographical location. A similar function is estimated to allocate a place of residence to external migrants. Parameters are estimated using conditional logistic regressions and are implemented into the microsimulation model. The model is validated over the 2006–2011 period and results of the reference scenario presented for 2031.
1. Introduction
Most demographic projections are realized at the national or regional levels and are mainly used for planning of public policies at this broader level. Using cohort-component or multi-state approaches these models are not adequate for planning of local services and needs, such as places in childcare or services for the elderly because they are unable to account for all the spatial interactions (Harding, Vidyattama et al., 2011). Yet, local and municipal governments also need tools for planning, in particular to ensure public services under their responsibility (aqueducts, parks, waste collection, etc.) and urban planning (Isserman 1984; Foss 2002; Swanson & Pol 2008). Small area population projections have unquestionable value: they can be used for planning purposes, but also in a prospective approach such as measuring the impact of a change in public policy, such as zoning, on the spatial distribution of the population (Ballas, Clarke et al., 2005a; Wilson 2011).
In addition, population projections at the local and municipal level have to account for the dynamic of residential segregation (Yin 2009). While in many North American cities residential segregation is related to ethnic or racial groups, Montreal differs from other North American cities by the presence of two main linguistic groups: the francophone majority, descendants of the first colonists who came from France and founders of the city, and a wealthier English-speaking minority which gradually developed after the British conquest of New France (Brunet 1955; Vaillancourt 1985; Séguin 1987). Montreal is also the port of entry of a large majority of immigrants landing in the province of Québec and recent high levels of increasingly diverse immigration has favored the emergence of another, more heterogeneous, linguistic group: the allophones, a term which in Canada defines those who speak another language than French or English at home. While racial or ethnical spatial segregation doesn’t appear to be important in the Montreal area, a spatial pattern is clearly apparent in the residential choice of linguistic groups (Marois & Bélanger 2014, Marois and Bélanger 2014, Forthcoming).
The aim of this paper is to present the small area population projection model that we developed to project the population of municipalities of the Montreal Metropolitan Community (MMC). The model is innovative in its treatment of migration, the most technically and conceptually difficult component of change to model in small area population projections. To meet these challenges, we build a dynamic time-based microsimulation projection model in which the choice of municipality of residence is determined by a utility function that considers municipality-specific contextual factors. The time horizon of the projection is from 2006 to 2031. This model has an additional objective: assess the evolution of linguistic groups at a local level.
2. Specific challenges of small area population projections
Small area population projection models are subject to specific methodological challenges that are less important for national population projections. Given the small size of the population, it is more difficult to accurately estimate the component of changes for small areas (Keyfitz 1972; Ballas, Rossiter et al., 2005b; Lutz 2009; Cameron & Poot 2011). This problem is particularly important for events that have a strong geographic dimension, such as internal migration and destination choice of external migrants (Ballas, Rossiter et al. 2005b). Furthermore, because for several origin-destination flows, the number of migrants is small to non-existent, a robust origin-destination matrix to determine the migration pattern can hardly be built.
Given the importance of migration on population growth and change at the local level and given the instability of migration patterns over time, the accuracy of the projection can be greatly affected by mobility assumptions (Sanderson, Dal et al. 2010, Cameron & Poot 2011). At this level, individual decisions regarding choice of a place of residence depends on the changes over time in each potential location relative to all other alternatives. Thus, another difficulty faced when projecting small area populations is related to the implementation of contextual factors which may highly influence individual decision-making and local population growth. A rigorous small area population projections model must also take into account those contextual variables that can be determining factors in the migrants’ decision-making, such as the distance from a central point, the socio-demographic composition or physical characteristics of the territory (Murdock, Hamm et al. 1991; Chi, Zhou et al. 2011). Similarly, urban planning can sometimes affect the projection since it has a major role in housing supply (Murdock, Hamm et al. 1991, Dittgen 2008, Bergouignan 2010). Geographical and contextual variables should thus be implemented as parameters to avoid the self-fulfilling effect of projections (e.g., when the urban plan is modified to integrate previous projection results). However, most small area projection models ignore contextual and environmental factors. Accordingly, traditional demographic methods such as the Hamilton-Perry method, the top-down method or the iterative proportional fitting method are generally used (Hamilton & Perry 1962; Birkin & Clarke 1989; Rees 1994; Rees, Norman et al. 2004; Simpson & Tranmer 2005; Ballas, Clarke et al. 2005a; Institut de la statistique du Québec 2010; Menthonnex 2010; Swanson, Schlottmann et al. 2010).
3. Modeling internal migration and residential location
The method proposed in this paper to model internal migration and residential-choice combines elements from the life cycle approach and the random utility model. Most studies seeking to explain individual decisions regarding residential mobility are based on the life cycle approach (Glick 1947; Rossi 1955; Landale & Guest 1985; South & Crowder 1997; Kim, Horner et al., 2005; Æro 2006; Marois & Bélanger 2014). This approach suggests that events that mark the life cycle, such as union formations and dissolutions, births of children, or the departures of children from parental house, are determinants of residential mobility, because the residential needs of the family are changing after the occurrences of these events. Since they are generally correlated with age, this variable is therefore a key determinant of residential mobility.
The literature distinguishes two main urban forms in North American metropolitan areas: the inner city, which for conceptual and methodological reasons is often defined as the central municipality, and the suburb. The inner city can be seen as a place of transition, especially for young people who study or are in search for a first job and a partner (Kasarda, Appold et al., 1997; Glaeser, Kolko et al., 2001; Fréchette, Desmarais et al., 2004; Turcotte & Vézina 2010; Marois & Bélanger 2013). According to the life cycle perspective, when they will be professionally stable and will be ready to have children, their preferences will be for larger housing and a quieter environment rather than for employment accessibility. They will therefore leave for the suburbs, if they can. (Frey & Kobrin 1982; Feijten & Mulder 2002; Karsten 2007; Marois & Bélanger 2014).
Because of the large number of municipalities in the Montreal metropolitan area, it is not possible to estimate an origin-destination matrix, especially when the population is disaggregated by age and language groups. But, if the determinants of the decision to move from the central city to the suburb differ from those of a reciprocal move from suburbs’ residents, we can assume that they are similar for residents of all suburban municipalities. Thus, we propose, as a first step in the modeling of internal migration, to stratify migrants according to the type of move rather than by municipality of origin. In the Montreal metropolitan area, the inner city consists of only one municipality (the municipality of Montreal, which is the central city). Residential moves within the central municipality are therefore not considered as a migration event. We can therefore define three types of internal mobility:
From a suburb to the central municipality;
From the central municipality to a suburb;
From a suburb to another suburb.
In a second step, a new municipality of residence has to be assigned to those internal migrants. In addition, a large number of external migrants also arrive each year in the metropolitan area, some from abroad (international immigrants), some from elsewhere in Canada (interprovincial migrants) and others from other regions of Quebec (intraprovincial migrants) and a municipality has to be assigned to these newcomers too. To account for the various profiles and preferences of these migrants in their location-decision, we regroup them into three additional groups of migrants:
International immigrants;
Interprovincial migrants;
Intraprovincial migrants.
For those who move from a suburb to the central municipality, the model does not need to be more complex, since there is only one possible destination by definition. For the other five groups of migrants, the model must assign a municipality of residence and this is done using the following random utility approach.
Assuming that migrants want to maximize the utility of attributes of the municipality they choose as destination, this approach can be defined as follow. Let be a utility function for each possible alternative j for individual of type t, where t is the type of migrants (from the central municipality, from another suburb, from another country, from another province and from the rest of Quebec) and j the number of municipalities which has a set of zn characteristics. Thus, we have:
where
= Utility of a municipality j for a migrant type t, j=1…J; t=1…n
zkj = Value of the independent variable k for the municipality j, j=1…J; k=1…n
βk = Parameter of the independent variable k, k=1…n
Parameters βk are estimated by a maximum likelihood method and are constant for each alternative. They estimate the net impact of municipalities’ characteristics. We seek to estimate the probability that an individual i of type t chooses the municipality j with utility function. Thus, we have:
In this way, contextual variables can be included as explanatory variables of migrants’ decision for a municipality of destination. In the context of Montreal, previous analysis has shown the importance of the municipality’s accessibility and housing offer, as well as of the linguistic composition of the municipality (Marois & Bélanger 2014, Forthcoming). Additional variables such as the average value of housing and the socio-economic composition of the municipality also became apparent from the analysis, but since reliable long-term assumptions for them are not available, they are not included in the population projection. Therefore, five municipality-specific variables are included in the model:
Distance from the downtown area;
Population size;
Number of new housings;
Linguistic composition;
Geographical position.
4. Model definition, assumptions and data sources
The proposed method for residential location modeling focuses on individual preferences which vary according to personal characteristics. The projection model must therefore use a micro approach and microsimulation is the preferred method. Microsimulation simulates processes and life events (e.g., mortality, fertility, residential mobility, etc.) of individuals following behavioral assumptions which parameters are derived from empirical data (Orcutt 1957). The probability that each type of events occurs is calculated for each individual and the occurrence of a particular event is determined using a Monte Carlo process. Following the event, characteristics of the simulated individual may change (life status is changed to dead, number of births is incremented, place of residence changes, etc.). Statistical indicators, such as population size, age structure, socio-demographic composition, etc. can then be computed from the aggregation of individual data. Post and Van Imhoff (1998) argue that microsimulation is particularly appropriate when “the problem requires a large state space” (p. 107). The possibility of including a large number of individual attributes is another major advantage of microsimulation compared to a component-cohort method. This method is then appropriate for local projections because of the large number of municipalities and individual characteristics that are simultaneously projected.
Montreal is the second most populous metropolitan area of Canada after Toronto. The Montreal Metropolitan Community (MMC)1 regroups 82 municipalities into a supra-municipal entity2. The population of the MMC is estimated to 3.7 million residents in 2010. The MMC is active in land use planning and economic development, public transit and metropolitan arterial road network developments, waste management planning and social housing. With more than 1.6 million people, the municipality of Montreal is the central city, while the rest of the MMC compose the suburb (78 municipalities). Map 1 spatially illustrates the municipalities under study and shows their grouping into regional county municipality (RCM)3, a spatial aggregation used for some variables in the analysis.
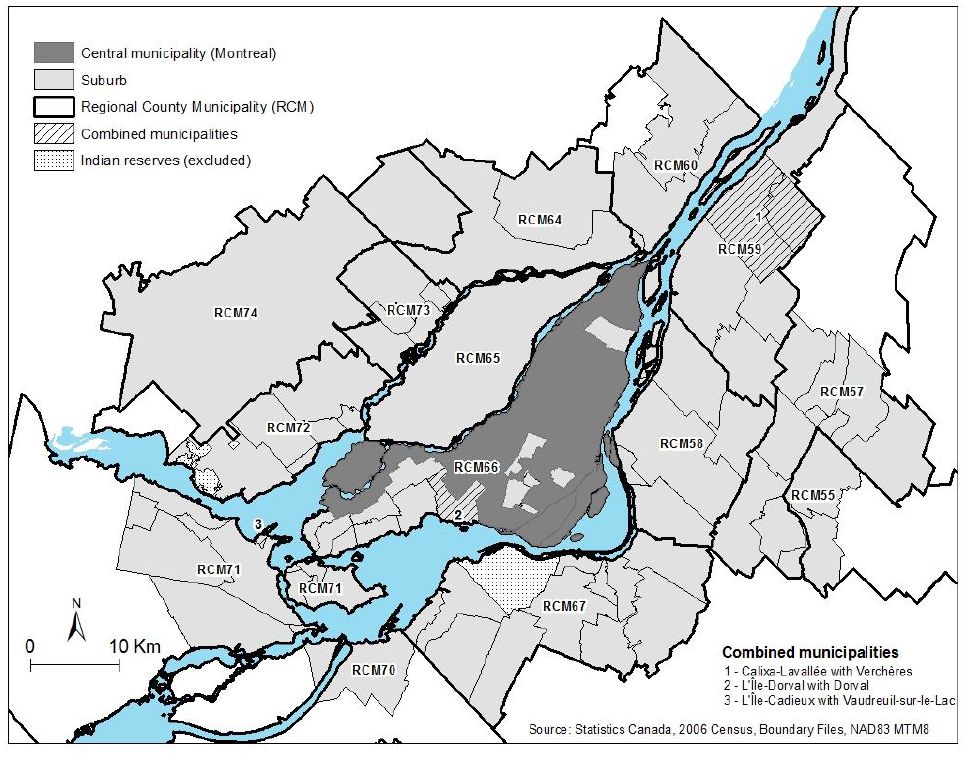

The central municipality of the MMC and municipalities included in the suburb.
Our dynamic time-based microsimulation model is called LDS (Local Demographic Simulations) and is built using SAS Software. The starting population is extracted from the 2006 Census and the projection’s horizon is 2031. The 20% microdata file of the 2006 Canadian Census4 provides a large database (682 000 respondents in the MMC territory) with all the individual characteristics necessary for our model. It makes up our starting population. Its large sample size is useful to ensure robust estimates of relatively rare events and to reduce the Monte Carlo error inherent to microsimulation. The following characteristics are extracted from the database:
Age (0 to 119);
Sex (male or female);
Municipality of residence (79 municipalities of the Montreal Metropolitan Community);
Place of birth (in Canada, foreign-born);
Year of arrival in Canada (specific to foreign-born);
Language spoken at home (English, French or other).
From these variables, we derive four other variables that will be used in different modules:
Age at immigration (specific to foreign-born);
Number of years since arrival (specific to foreign-born);
Regional county municipality of residence;
Type of municipality (central municipality or suburb).
To account for the net census undercount (2.07% in Quebec), we reweighted the population using the 2006 population estimate by age groups and municipalities (Institut de la statistique du Québec 2013). Each individual weight is corrected using an age group-municipality-specific factor.
Modeled events are represented schematically in Table 1, with the independent variables where appropriate:
Summary of events.
| Events | Population at risk | Outcome | Independent variables | ||||||||
|---|---|---|---|---|---|---|---|---|---|---|---|
| Age | Sex | Place of birth | Number of years since arrival | Age at immigra-tion | RCM | Munici-pality | Type of municipality | Language spoken at home | |||
| Death | Everyone | If the event occurs, the individual is removed from the simulation. Otherwise, time variables (age, duration of residence for immigrants) are incremented by one | x | x | x | x | |||||
| Fertility | Women aged between 15 and 49 years old | A new individual is added to the simulation. Child characteristics are determined in the birth module | x | x | x | x | x | ||||
| International emigration | Everyone, except births of the year | The individual is removed from the simulation | x | x | |||||||
| Interprovincial out-migration | Everyone, except births of the year | The individual is removed from the simulation | x | x | x | x | x | ||||
| Intraprovincial out-migration | Everyone, except births of the year | The individual is removed from the simulation | x | x | x | x | |||||
| Migration from the central municipality to the suburb | People living in the central municipality, except births of the year | The individual is identified as a migrant from the central municipality to the suburb. The municipality of residence is determined in the residential location module | x | x | |||||||
| Migration from the suburb to the central municipality | People living in the suburb, except births of the year | The municipality of residence becomes the central municipality (Montreal) | x | x | x | ||||||
| Migration within the suburb | People living in the suburb, except births of the year | The individual is identified as a migrant within the suburb. The municipality of residence is determined in the residential location module | x | x | x | x | |||||
| Language shift toward French | Allophones | The language spoken at home is changed to French | x | x | x | x | |||||
| Language shift toward English | Allophones | The language spoken at home is changed to English | x | x | x | x | |||||
Characteristics at the beginning of the period are used to estimate the likelihood of each event. For example, a 20 year old woman living in a given municipality at the beginning of the year who migrates to another municipality during the year has the probability of giving birth of women aged 20 living in the initial municipality for all the period. Only in the following year, when she will be 21 at the beginning of the year, will her probability of giving birth change.
4.1 Death event
Mortality has less impact on projected local population counts than other demographic components and varies less between regions (Termote, Payeur et al. 2011). Therefore, we assume that probabilities of dying do not vary by municipality of residence. Provincial age and sex prospective probabilities of dying from the reference scenario of the population projections published by the provincial statistical agency (Institut de la statistique du Québec 2009) are used as input. Life expectancy at birth increases from 78.3 years in 2006 to 82.9 years in 2031 and from 83.0 years to 86.6 years for males and females, respectively. To take into account the healthy immigrant effect (Chen, Ng et al., 1996; Bourbeau 2002; McDonald & Kennedy 2004), we adjust the probabilities of dying using relative risks of mortality for Canadian-born, established immigrants (admitted 10 years earlier or more) and recent immigrants (admitted in last 10 years) estimated in a previous study (Bélanger & Malenfant 2005). These relative risks are 0.354 for recent immigrants, 0.96 for established immigrants and 1.029 for Canadian-born.
4.2 Fertility and birth modules
The fertility module is applied to women aged 15 to 49. Fertility rates are estimated in two steps. First, we estimated fertility rates by age, language spoken at home and type of municipality (central municipality or suburb) using the own children method applied to 2006 Census data. As expected, our results show that fertility is lower among women living in the central city than those living in the suburbs for francophones (1.33 vs 1.66) and anglophones (1.47 vs 1.75), but not for allophones (2.35 vs 1.87). One reason that can explain this last finding is that fertility tends to be higher among recent immigrants (Bélanger & Gilbert 2002) who are more likely to be allophones. Since most immigrants first settle in the central municipality, it can inflate the estimate. As the duration of residence in Canada increases, immigrants’ fertility converges towards the level of the native-born population and at the same time immigrants tend also to move to other areas of the metropolitan area. Using these rates as input, we performed a first simulation from 2006 to 2011 and we compared the projected number of births by municipality with the observed numbers. We then calibrated municipality’s fertility rates so that the total number of simulated births for each municipality matches the recorded data while the relative differences between population groups were maintained5.
When a birth occurs, a new individual is added to the simulation and the birth module assigns characteristics to newborns. Age is set to 0, the sex ratio at birth is used to randomly allocate the sex of the newborn, the place of residence is set equal to the residence of the mother at the end of the projected year and a probability of surviving to the end of the year is applied to the newborn. The language group of the child can be different from the language of the mother due to the possibility of intergenerational language shifts and is randomly allocated following rules described in the next section.
4.3 Linguistic mobility events
They are two types of language shifts. Language shifts over the life course concern change in the language used at home by the individual over his own life and intergenerational language shifts concerns the non-transmission of the mother’s mother tongue to the child at birth. Although Canada is rich of linguistic questions in censuses and surveys, there is no data set that can provide direct estimates of linguistic mobility. It is therefore necessary to use alternative methods to estimate language shifts over the lifetime. From analysis comparing cohort data from two censuses, we know that linguistic mobility is very low for both anglophones and francophones (Termote, Payeur et al. 2011). In Quebec, language changes over the life course mainly concern allophones and even among them such transitions are rare past a given age. We adapted the census based cross-sectional method developed by Sabourin and Bélanger (2011) to estimate these transitions. First, those who answered speaking more than one language at home are randomly recoded into the three main categories: francophones, anglophones and allophones. Allophones are then stratified into four groups to take into account specific experiences that may affect their linguistic behavior: Canadian-born allophones, foreign-born allophones arrived at age 15 or younger, foreign-born allophones arrived between age 16 and 35 and foreign-born allophones arrived after the age of 35. Using the number of respondents declaring a non-official language as mother tongue as denominators and the number of those speaking English or French at home as numerators, we computed age-specific (in the case of Canadian-born) or duration-specific (in the case of immigrants) lifetime linguistic shift rates for each group of allophones.
Language shifts over the lifetime were rare among foreign-born allophones who arrived at an age older than 16 and, for simplicity, language shifts over the lifetime are assumed to be null for allophone immigrants who landed in Canada at age16 and over. For the other two groups, the following equations, where y is the shift rate and x is the age or the duration (in years) since immigration, provided the best fit to the observed data:
Canadian-born allophones to French: y = −0.0003x2 + 0.0135x + 0.1334, x = 0 to 14;
Foreign-born allophones arrived at age 15 or less to French: y = −0.0002x2 + 0.0129x + 0.2188, x = 0 to 29;
Canadian-born allophones to English: y = 0.0155x + 0.084, x = 0 to 34;
Foreign-born allophones arrived at age 15 or less to English: y = 0.0055x + 0.0438, x = 0 to 29;
These equations yield estimates of the probability of language shift toward French and English by age (duration). We have limited the length to 35 years for the Canadian-born allophones transition to English, not only because the event is rare after that age, but also because of a cohort effect due to the linguistic policy6.
In addition to lifetime language shifts, there is another kind of language shift called intergenerational language shift. Previous estimates show that a certain proportion of allophones already have another language spoken at home at age 0. Since we don’t have more specific data on this event, we assume that this represents intergenerational shifts. From the regressions’ intercepts, intergenerational language shift are estimated to 13.3% and 8.4% for French and English respectively. These rates are used to allocate a language characteristic to children from allophone mothers in the birth module.
4.4 International emigration event
In Canada, international migration is estimated from linked tax files. Although there exist scarce data on this component of population change, we know that it is a rare event and that it concerns mostly recent immigrants. In fact, the number of returning Canadians compensates for the number of Canadian-born emigrants (Michalowski & Tran 2008, Termote, Payeur et al., 2011). Thus, assuming that the net emigration of Canadian-born is null, emigration depends only on the propensity of recent immigrants to leave the country. We thus apply to each cohort of immigrants the emigration rate estimated by Termote, Payeur et al. (2011) (Table 2). Emigration rates are further calibrated using the observed number of international emigrants between 2006 and 2011.
Estimated emigration rates of immigrants by years since arrival.
| Number of years since arrival | Emigration rate |
|---|---|
| 1 | 4.40% |
| 2 | 4.40% |
| 3 | 2.95% |
| 4 | 1.50% |
| 5 | 1.50% |
| 6 | 1.50% |
| 7 | 1.50% |
| 8 | 1.40% |
| 9 | 1.30% |
| 10 | 1.30% |
| 11 | 1.30% |
| 12 | 1.30% |
| 13 | 0.65% |
-
Source: Termote, Payeur et al. 2011. Annualized by authors.
4.5 Interprovincial and intraprovincial out-migration events
Probabilities for interprovincial and intraprovincial out-migration are calculated from parameters estimated by logistic regressions using the question on place of residence one year ago in the 2001 and 2006 censuses. The event is thus conditional to survive and to stay in Canada. Therefore, this module occurs after death and emigration modules in the model LDS. Results of the regressions are presented in Table 3.
Parameters of interprovincial and intraprovincial outmigration, Montreal metropolitan community, 2001 and 2006 census.
| Interprovincial out-migration (n=1,292,224) | Intraprovincial out-migration (n=1,292,224) | |
|---|---|---|
| Intercept | −5.796*** | −3.652*** |
| Age groups (ref=30–34) | ||
| 0–4 | −0.063 | −0.173*** |
| 5–9 | −0.268*** | −0.632*** |
| 10–14 | −0.718*** | −0.955*** |
| 15–19 | −0.696*** | −0.707*** |
| 20–24 | 0.322*** | 0.263*** |
| 25–29 | 0.419*** | 0.305*** |
| 35–39 | −0.338*** | −0.387*** |
| 40–44 | −0.619*** | −0.688*** |
| 45–49 | −0.812*** | −0.789*** |
| 50–54 | −0.956*** | −0.651*** |
| 55–59 | −0.993*** | −0.534*** |
| 60–64 | −0.874*** | −0.638*** |
| 65–69 | −1.285*** | −0.896*** |
| 70–74 | −1.461*** | −1.357*** |
| 75+ | −1.024*** | −1.381*** |
| Language spoken at home (ref = French) | ||
| English | 2.206*** | −1.680*** |
| Other(s) | 1.421*** | −1.856*** |
| Place of birth (ref = born in Canada) | ||
| Foreign-born | −0.883*** | |
| Number of years since arrival (ref = Born in Canada) | ||
| 0–4 | 1.074*** | |
| 5–9 | 0.602*** | |
| 10–14 | 0.189** | |
| 15+ | −0.291*** | |
| RCM of residence (ref = RCM66) | ||
| RCM55 and RCM57 | −0.581*** | 0.326*** |
| RCM58 | −0.420*** | −0.067* |
| RCM59 | −0.228 | 0.086 |
| RCM60 | −1.113*** | 0.163*** |
| RCM64 | −0.817*** | −0.009 |
| RCM65 | −0.870*** | −0.252*** |
| RCM67 and RCM70 | −0.393*** | 0.060 |
| RCM71 | −0.205** | 0.388*** |
| RCM72 | −0.698*** | −0.199** |
| RCM73 and RCM74 | −0.546*** | 0.236*** |
-
*
p<0.05.
-
**
p<0.01.
-
***
p<0.0001.
To validate the model, we compared the number of out-migrants observed by municipality in the 2001 and 2006 Census separately with the number resulting from the average of five probabilistic simulations using the estimated parameters. The projected numbers are usually close to the observed numbers for both interprovincial and intraprovincial out-migrants. Relative differences can be important for small municipalities with few observed out-migrants, but expected numbers are in the same range.
In a first step, we use these parameters in a simulation for the period 2006–2011. Probabilities were then calibrated to ensure that the number of out-migrants simulated for the MMC corresponds to the observed numbers. The calibration factor is 0.761 and 1.162 for interprovincial and intraprovincial out-migrants, respectively. Those factors are then maintained for the rest of the projection.
4.6 Internal migration events
Probabilities to move from the central municipality to a suburban municipality, between suburbs or from a suburban municipality to the central municipality are estimated using logistic regressions on pooled data of the 2001 and 2006 censuses. Table 4 presents the estimated parameters from these models.
Parameters of logistic regressions modeling internal outmigration between municipalities of the Montreal metropolitan community, 2001 and 2006.
| From the central municipality to the suburb (n=586,151) | From the suburb to the central municipality (n=682,659) | Within the suburb (n=682,659) | |
|---|---|---|---|
| Intercept | −3.024 *** | −3.741 *** | −3.004 *** |
| Age groups (ref=30–34) | |||
| 0–4 | −0.089 * | −0.836 *** | −0.199 *** |
| 5–9 | −0.501 *** | −1.092 *** | −0.558 *** |
| 10–14 | −0.753 *** | −1.479 *** | −0.935 *** |
| 15–19 | −1.065 *** | −0.518 *** | −0.892 *** |
| 20–24 | −0.490 *** | 0.787 *** | 0.064 * |
| 25–29 | 0.058 | 0.711 *** | 0.485 *** |
| 35–39 | −0.321 *** | −0.502 *** | −0.443 *** |
| 40–44 | −0.743 *** | −0.804 *** | −0.810 *** |
| 45–49 | −1.030 *** | −0.871 *** | −1.095 *** |
| 50–54 | −1.253 *** | −0.976 *** | −1.184 *** |
| 55–59 | −1.281 *** | −1.263¨*** | −1.264 *** |
| 60–64 | −1.397 *** | −1.521 *** | −1.412 *** |
| 65–69 | −1.517 *** | −1.512 *** | −1.518 *** |
| 70–74 | −1.748 *** | −1.469 *** | −1.529 *** |
| 75+ | −1.658 *** | −1.226 *** | −1.308 *** |
| Language spoken at home (ref = French) | |||
| English | −0.353 *** | −0.361 *** | |
| Other(s) | −0.631 *** | −0.662 *** | |
| Place of birth (ref = born in Canada) | |||
| Foreign-born | 0.170 *** | −0.200 *** | |
| RCM of residence (ref = RCM66) | |||
| RCM55 and RCM57 | −0.477 *** | 0.386 *** | |
| RCM58 | −0.127 ** | 0.126 ** | |
| RCM59 | −0.456 *** | 0.091 | |
| RCM60 | 0.120 * | −0.278 *** | |
| RCM64 | −0.288 *** | 0.083 * | |
| RCM65 | −0.133 ** | −0.208 *** | |
| RCM67 and RCM70 | −0.295 *** | 0.224 *** | |
| RCM71 | −0.277 *** | 0.232 *** | |
| RCM72 | −0.429 *** | 0.593 *** | |
| RCM73 and RCM74 | −0.556 *** | 0.430 *** |
-
*
p<0.05.
-
**
p<0.01.
-
***
p<0.0001.
Estimated parameters are consistent with previous theoretical and empirical studies on intrametropolitain mobility (Glick 1947; Rossi 1955; Landale & Guest 1985; South & Crowder 1997; Kim, Horner et al. 2005; Æro 2006; Turcotte & Vézina 2010; Marois & Bélanger 2013; Marois & Bélanger 2014). They highlight the importance of age and ethnocultural variables as determinants of intrametropolitain mobility. The variable about the RCM of residence shows that, even when controlling for population composition, some differences still remain between regions, meaning that a specific geographical component exists. As we did for modeling interprovincial and intraprovincial out-migrations, we also validated our model for internal migration by comparing the number of migrants observed by municipality in the 2001 and 2006 Census separately with the average number resulting from five probabilistic simulations for the same years using those parameters. Simulated numbers are in most cases in the same range as the observed and when the relative differences are large, it is for small municipalities with few migrants.
In the microsimulation, internal migration occurs after the events “death”, “interprovincial and intraprovincial out-migration” and “emigration”. Eventual co-occurrence of events “migration to the central municipality” and “migration to another suburb” are dealt with randomly. The municipality of residence for those who move to or within the suburb is subsequently determined by the residential location module.
4.7 External migrants modules
External migrants, meaning international immigrants, interprovincial in-migrants and intraprovincial in-migrants are not modeled as events because the population at risk is not simulated. For each of these types of in-migrants, a separate database of potential newcomers with their characteristics was created. Assumptions on the annual number for each of these types of in-migrants comes from the official population projection from the Institut de la statistique du Québec, themselves determined from observations for 2006 to 2011 and from recent trends for the following years (Institut de la statistique du Québec 2009). The assumption is that the number of new entries in the model is about 96,500 per year which is about 40,000 international immigrants, 10,500 interprovincial in-migrants and 46,000 intraprovincial in-migrants moving on the MMC territory. Characteristics of these in-migrants are randomly imputed using a cold deck procedure based on a database of potential in-migrants created from the population living in the MMC at the 2006 Census, but elsewhere five years before. Assuming that external migrants arrive in the middle of the period, they are subject to half the risks of experiencing the other events during the year of their arrival. Finally, the residential location module (described below) assigns their municipality of residence.
4.8 Residential location modules
Residential location modules are used to assign a municipality of residence to internal migrants settling in the suburb and to external migrants settling in the whole metropolitan area. Since migrants have different preferences according to their origin, five separate modules are required, one for each of the categories of individuals to relocate: (1) people moving from the central municipality (2) people moving from another suburb (3) international immigrants (4) interprovincial in-migrants and (5) intraprovincial in-migrants. These modules are a practical application of the random utility approach that we applied in a previous study of residential location in the Montreal metropolitan area (Marois & Bélanger 2014, Forthcoming), which includes contextual variables as determinants of the choice of the municipality of residence. For each of the municipality’s characteristics, parameters are estimated using conditional logistic regressions. The municipality of destination is then probabilistically allocated as a function of these parameters.
We estimate the regression parameters using data from the question on the place of residence one year ago of the 2001 and 2006 censuses. Independent variables of the regression model are: the distance between the municipality and the downtown, the population size, the type of municipality (either village, town or city), the annual number of new housings7, the main linguistic group defined as a binary variable (either francophone or not) and the regional county municipality (RCM) of the municipality. This last variable is used to take into account certain individual choices, such as the preference of international immigrants to first locate on the Montreal island. Table 5 shows parameters resulting from our regressions.
Parameters of conditional logistic regressions modeling the municipality of destination for internal and external migrants, Montreal metropolitan community, 2001 and 2006 censuses.
| Intraprovincial in-migrants (n=14528) | Interprovincial in-migrants (n=4613) | International immigrants (n=14993) | Migrants from the central municipality (n=12565) | Migrants from another suburb (n=18080) | |
|---|---|---|---|---|---|
| Distance to downtown (km) | −0.014 *** | −0.007 ** | |||
| Population size | 1.894E-06 *** | 2.301E-06 *** | 2.444E-06 *** | 8.848E-06 *** | 7.864E-06 *** |
| Kind of municipality (ref = City) | |||||
| Village | −2.159 *** | −1.966 *** | −2.148 *** | −2.220 *** | −1.757 *** |
| Town | −1.233 *** | −0.997 *** | −0.971 *** | −1.155 *** | −0.831 *** |
| New housings | 5.230E-05 ** | 2.900E-04 *** | 2.097E-04 *** | ||
| Majority of Francophones | 3.224 *** | 0.937 *** | 1.490 *** | 0.544 *** | 0.754 *** |
| * anglophone migrant | −3.034 *** | −1.412 *** | −1.914 *** | −2.550 *** | −3.518 *** |
| * allophone migrant | −2.258 *** | −0.713 *** | −0.815 *** | −1.433 *** | −2.740 *** |
| RCM of residence (ref = RCM65 and RCM66) | |||||
| RCM55 and RCM57 | −0.773 *** | −1.438 *** | −2.455 *** | −0.007 | 1.527 *** |
| RCM58 | −0.117 * | −0.102 | −0.170 ** | 0.655 *** | 1.525 *** |
| RCM59 | −1.093 *** | −1.554 *** | −2.681 *** | 0.007 | 1.199 *** |
| RCM60 | −0.493*** | −1.475 *** | −2.459 *** | 1.115 *** | 1.315 *** |
| RCM64 | −0.386 *** | −0.927 *** | −2.363 *** | 1.057 *** | 1.994 *** |
| RCM67 and RCM70 | −0.988 *** | −1.855 *** | −2.995 *** | 0.530 *** | 1.324*** |
| RCM 71 | −0.893 *** | −0.282 * | −1.587 *** | 0.966 *** | 1.274 *** |
| RCM72 | −0.988 *** | −1.600 *** | −2.257 *** | 0.473 *** | 1.777 *** |
| RCM73 and RCM74 | −0.474 *** | −0.967 *** | −2.113 *** | 0.325 *** | 1.867 *** |
-
*
p<0.05.
-
**
p<0.01.
-
***
p<0.0001.
Results show the importance of accessibility, housing supply and linguistic composition of the municipality in the choice of the municipality of residence. For each in-migrants category, we compared the expected number of in-migrants using these parameters with the observed number in the 2001 and 2006 censuses. In most cases, expected numbers are in the same range than observed numbers, meaning that our regression models are good predictors of the migrants’ municipality of destination. Accordingly, we use these parameters as projection assumption. However, for some municipalities, the difference between the expected and observed in-migrants can be important, probably because some unobserved variables can influence municipalities’ attractiveness. In these particular cases, we added an adjustment factor to calibrate the model, which highlights the difficulty of conceiving a model that can be applied in all contexts.
The residential location modules take into account municipality’s characteristic that can change over time, therefore LDS updates at the end of each projection year the population size and percentage of francophones which will then be used in the following annual step. Concerning the number of new housings, we use the observed annual number of new housings for the 2006–2011 period (occupied or not) as reported in the 2006 and 2011 censuses. For the years beyond 2011, the projected number of new housings is taken from the 2005 development plan of the MMC which provides estimates of housing development potential for each municipality until 2031.
5. Using the 2006–2011 period to validate and calibrate the model
Our projection starts with the 2006 population, but we have age-municipality specific population estimates for 2011. Therefore, we are using the period 2006–2011 to validate and calibrate the parameters of the model prior to the 2011–2031 projection.
5.1 Completion of assumptions
Out-migration probabilities and municipality-specific fertility rates have to be adjusted from a set of simulations for the period 2006–2011. The population resulting from the first simulation, without any correction, is presented in column 3 of annex 1. The second simulation calibrated the out-migrations probabilities and results are shown in column 4. At the third simulation, we calibrated for the municipality-specific fertility rates. Results are presented in column 5.
5.2 Validation of the model
The last simulation is based on our final and complete assumptions (column 5 of annex 1) and serves to validate our projection model by comparing the projected population with the 2011 population estimates (column 2). Table 6 presents the distribution of municipalities according to the absolute percent error.
Distribution of municipalities according to the absolute percent error.
| [10%, ∞[ | 4 |
| [5%, 10%[ | 15 |
| [2.5%, 5%[ | 21 |
| [0, 2.5%[ | 39 |
The absolute percent error for the whole population is quite low for most municipalities, 39 of the 79 municipalities have an error below 2.5% and 21 have an error between 2.5% and 5%.
Overall, the mean absolute percent error is 3.4% and it varies from 0% to 20%. Four municipalities have an error above 10%, but the most populous of them has a population of about 10,000 inhabitants.
As revealed in Table 7, the absolute percent error decreases according to the population size, but there is no clear relation between error and population growth rate. The mean absolute percent error appears satisfying since Smith and Shahidullah (1995) found an absolute error range between 17% and 20% for projections over a 10 years period of Florida’s census tracts using different extrapolation technics.
Mean absolute percent error between population estimates in 2011 and the simulation by population size and growth rate of the municipality.
| Total population | Population by age groups (16)a | |
|---|---|---|
| Overallb | 3.4% | 12.3% |
| Population size | ||
| [50,000, ∞[ | 1.2% | 5.6% |
| [15,000, 50,000[ | 2.3% | 9.3% |
| [5,000, 15,000[ | 4.0% | 12.5% |
| [0, 5,000[ | 5.7% | 21.4% |
| Population growth rate 2006–2011 | ||
| [10%, ∞[ | 4.3% | 10.7% |
| [5%, 10%[ | 2.9% | 10.7% |
| [0%, 5%[ | 3.0% | 13.1% |
| ]-∞, 0%[ | 4.1% | 15.1% |
-
a
This is the arithmetic mean of the MAPE of 16 age groups.
-
b
This is the arithmetic mean of the MAPE of the 79 municipalities.
Table 7 also revealed that the absolute percent error is higher when the population is detailed by age groups. Overall, the mean absolute percent error by age groups is 12.3%. Again, it is lower for largest municipalities, but higher than average for the smallest municipalities. Those with a population below 5,000 have a mean absolute percent error of 21.4%, but it concerns very small population groups.
5.3 Calibration of the population
The only database available detailing the population by age, sex, language, immigrant status and municipality of residence is the 2006 Census. The 2011 Census is not yet available to researchers and, moreover, methodological changes make the data less reliable8 and not comparable with 2006 data for statistics related to language (Statistique Canada 2012) or other characteristics. We must therefore exclude this source for calibration. Population estimates from the Institut de la statistique du Québec used to correct the net undercount of the initial census population of 2006 may still serve here, this time taking the 2011 estimates. It provides a complete and reliable source of population estimates by age groups and municipalities which we use to reweight the 2011 resulting population. The average of this weighting variable is 1.02, meaning that the model underestimates the population of the MMC by about 2% before this correction.
6. Simulation 2011–2031
Once the 2011 population resulting from the simulation is calibrated with the 2011 population estimates, we can run the 2011–2031 population projection. Results from this simulation are presented in the column 6 of annex 1. Map 2 presents population growth rates by municipality and Table 8 presents a synthesis of the results.
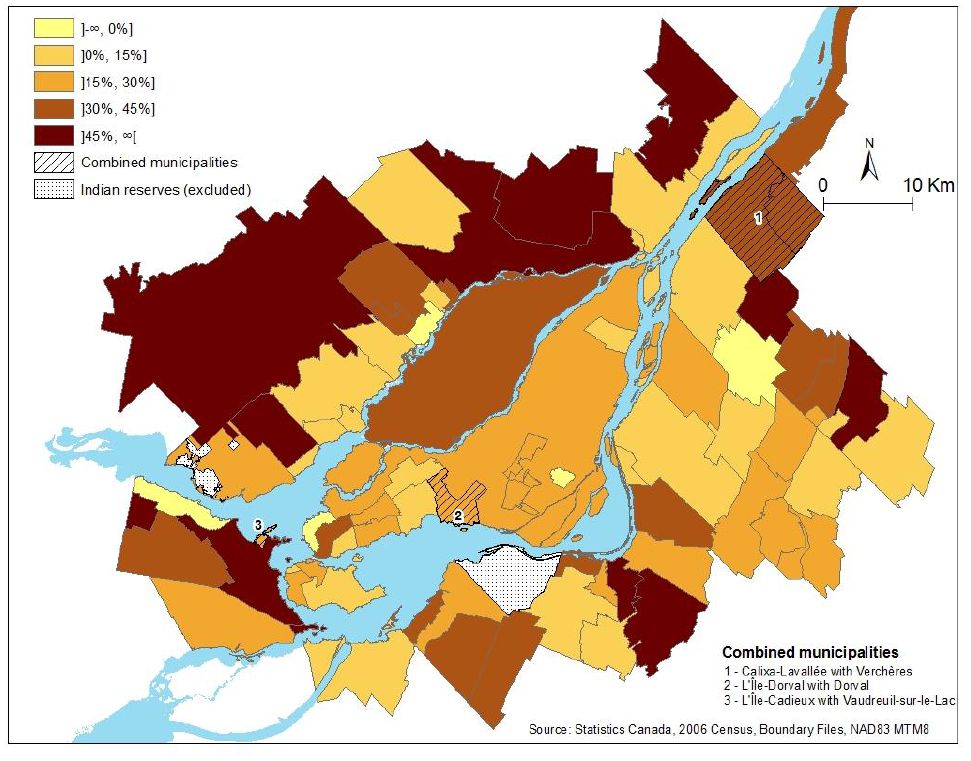

Projected population growth rates by municipality, MMC, 2006 to 2031.
Synthesis of population projection results, MMC, 2006–2031.
| Distribution of municipalities by population growth between 2006–2031 | |
| [50%, ∞[ | 10 |
| [25%, 50%[ | 23 |
| [10%, 25%[ | 28 |
| [0%, 10%[ | 13 |
| ]-∞, 0%[ | 5 |
| Mean relative growth by initial municipality’s population size | |
| [50,000, ∞[ | 33.4% |
| [15,000, 50,000[ | 25.9% |
| [5,000, 15,000[ | 23.5% |
| [0, 5,000[ | 26.2% |
The projected growth between 2006 and 2031 for the whole MMC is 27.5%, which is consistent with the official population projection (Institut de la statistique du Québec 2010). The projected growth varies widely between municipalities from −38.1% to 82.9%. Municipalities that will have the fastest expected relative growth are located on the North Shore, mostly those which are at the limit of the MMC. These municipalities are new suburbs where the development potential is the largest according to urban plans. Our model predicts low growth for most municipalities on the island of Montreal (RCM66, see Map 1) and in oldest suburbs (RCM58, RCM72 and RCM73), where housing potential development are much lower because the land is already occupied. This shows the importance of this variable in small area population projections. Urban sprawl, however, could be limited by protecting agricultural land and increasing residential density in other parts of the MMC to absorb projected population growth, but this would necessitate major policy changes, which are clearly not in the assumptions of the authors of the urban plans.
As for the rest of the country, an important population aging is expected in the MMC. Our results show that the proportion of people aged 65 and over will grow from 13.2% in 2006 to 19.2% in 2031. Overall, this age group will increase from about 475,000 people to 893,000 people, or by 88.1%. However, population aging won’t affect all municipalities in the same way. Map 3 displays the projected growth of the population aged 65 and over by municipality and clearly shows rapid population aging in several suburban municipalities. Actually, municipalities that currently or in the near future show fast population growth and are attractive to young families, will see faster population aging. In the future, parents of these families will age in place, while their children will more likely migrate to the central municipalities or elsewhere. As a result, the population aged 65 and over can quadruple in some of them between 2006 and 2031. At the opposite end, because this process of aging-in-place and migration of the youths is already much completed in the central municipality and in the oldest suburbs of the inner ring, the future growth of the elderly population will be relatively much smaller.
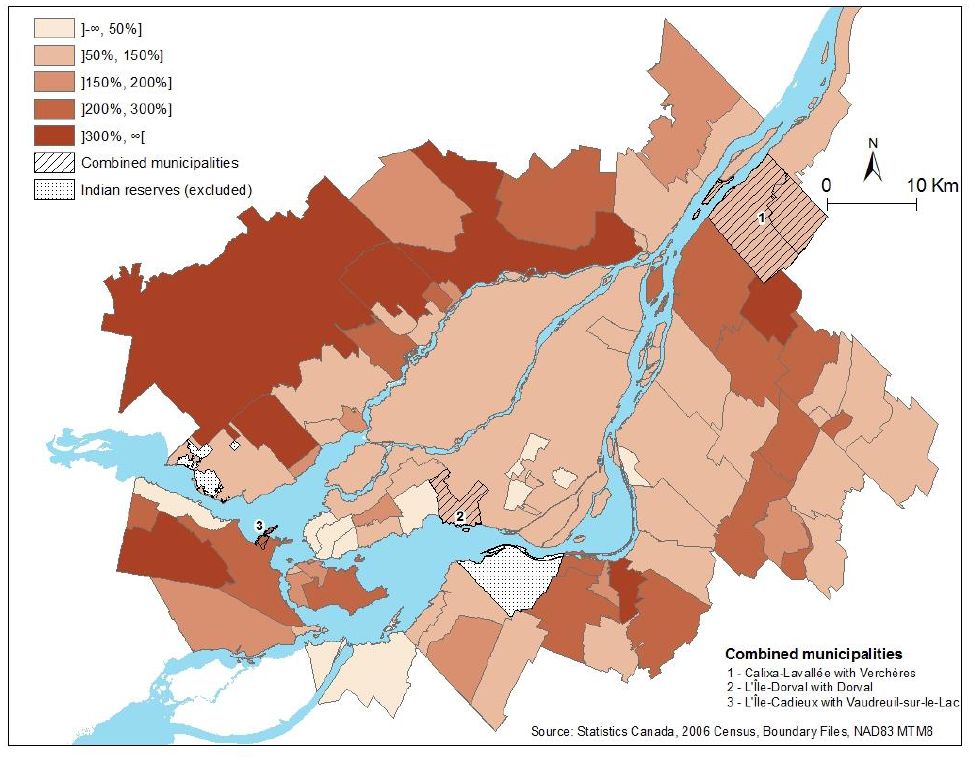

Projected growth of the population aged 65 and over by municipality, MMC, 2006 to 2031.
The main advantage of microsimulation is that it can generate results along several dimensions, such as linguistic characteristics in this case. In the Montreal context, where the spatial distribution of population by language groups is the subject of constant debates (Termote, Payeur et al. 2011), it should be of interest to look at projected results by language.
Table 9 presents the distribution of municipalities according to the relative rate of change in the proportion of francophones from 2006 to 2031. Overall, for the whole MMC, the proportion of francophones declines from 69.7% in 2006 to 63.8% in 2031, a loss of 6 percentage points, which is consistent with a similar projection for the Montreal metropolitan area (Termote, Payeur et al. 2011). The range of the variation varies from −28.3 to 17.1 percentage points. Our results show that the proportion of francophones will decline in 65 of the 79 municipalities. This is mainly caused by the low fertility of Canadian-born population and high immigration of non-francophones. At the opposite, our projection predicts an increase of the proportion of francophones in 14 municipalities.
Distribution of municipalities according to the relative rate change in the proportion of francophones (percentage points), 2006 to 2031.
| [0, ∞[ | 14 |
| [−5, 0[ | 12 |
| [−10, −5[ | 11 |
| [−15, −10[ | 33 |
| ]-∞, −15[ | 9 |
7. Conclusion
Small area population projections are subject to particular challenges. One of them is to take into account local conditions that may affect future population growth, particularly through residential moblity. In this study, we present a dynamic time-based microsimulation model, called LDS, that includes, among others variables, the planned number of new houses and the distance from downtown as determinants of residential location for internal and external migrants to project the population of the Montreal Metropolitan Community’s municipalities. Furthermore, it takes into account the particular context of Montreal as the only metropolis in North America that is the home of a large francophone community and is receiving a large influx of immigrants from diverse origins and languages. We thus add to our model differential behaviors according to linguistic groups for mobility, residential location and reproduction, so the model can also project population at a local level by language groups.
Many small area projection models exist, but the one developed in this paper innovates in its treatment of mobility. We used conditional logistic regressions to estimate parameters used as assumptions of the residential location module. The method allowed for the implementation of the effect of contextual variables such as planned new housings from urban development plans, socio-demographic composition and of geographical location as determinants of future residential location process. Moreover, concerning the socio-demographic composition of the population, we develop LDS with a specific interest to linguistic variable which is an important issue in the Montreal metropolitan area context, but its methodology could be transposed to other variables, such as family composition, race or ethnicity which are also parameters that determinate mobility.
Like all models, our model has some limits. The parameters used to model residential location performs generally well, but for some municipalities, the discrepancy can be important and parameters were subject to some calibration. Another limit concerns the geographic scale. For a large city like Montreal, projections at the neighbourhood level might be useful, but the Census question on place of residence one year ago does not allow the analysis of mobility at a finer geographical scale than the municipality.
This small area population projection model reveals some trends that could challenge public policies. One of them is the continuous urban sprawl implied mostly by the urban development plans used as assumptions. Municipalities with the fastest expected growth are located far from the core, where farm and forest lands still exist. The second challenge concerns the investment in local infrastructure to face the aging of the population. Municipalities where the elderly population is expected to grow the fastest are those that nowadays attract young families. In the next decades, their infrastructure might need to be adapted for this changing population. Another result from our projections which can be of concern to policy-makers is the relative decline of the French community, which will be generalized in most of the MMC. As the language most commonly spoken in the neighbourhood is an important determinant of linguistic integration of allophones (Carpentier 2004), the relative decline of French in most municipalities could therefore be an obstacle to the adoption of French by the fast-growing foreign-born population.
Annex 1
Table Results from simulations and population estimates.
| Population estimates | Results from 2006–2011 pre-simulations | |||||
|---|---|---|---|---|---|---|
| 2006 | 2011 | No adjustment | Out-migration assumption adjusted | Fertility assumption adjusted | Results from 2011–2031 simulation | |
| (1) | (2) | (3) | (4) | (5) | (6) | |
| Montréal | 3,570,100 | 3,791,100 | 3,758,132 | 3,781,745 | 3,783,223 | 4,553,217 |
| Baie-D’Urfé | 3,900 | 3,930 | 3,828 | 3,620 | 3,850 | 4,151 |
| Beaconsfield | 19,255 | 20,330 | 19,557 | 20,269 | 20,332 | 24,016 |
| Beauharnois | 12,000 | 12,235 | 11,117 | 11,145 | 11,186 | 12,523 |
| Beloeil | 19,135 | 20,465 | 20,944 | 20,852 | 20,581 | 25,210 |
| Blainville | 47,025 | 53,165 | 52,059 | 51,757 | 51,568 | 63,538 |
| Boisbriand | 26,700 | 26,485 | 26,791 | 26,823 | 26,855 | 29,541 |
| Bois-des-Filion | 8,455 | 9,450 | 9,591 | 9,540 | 9,321 | 12,165 |
| Boucherville | 39,275 | 41,570 | 41,073 | 41,176 | 41,254 | 46,811 |
| Brossard | 71,765 | 80,235 | 79,763 | 80,580 | 79,432 | 95,579 |
| Candiac | 16,145 | 19,575 | 18,691 | 18,739 | 19,259 | 28,188 |
| Carignan | 7,545 | 8,020 | 7,989 | 7,637 | 8,009 | 9,414 |
| Chambly | 22,880 | 25,440 | 23,549 | 23,677 | 23,673 | 27,527 |
| Charlemagne | 5,670 | 5,775 | 5,621 | 5,697 | 5,965 | 6,480 |
| Châteauguay | 43,140 | 46,330 | 45,417 | 46,167 | 45,391 | 55,330 |
| Contrecoeur | 5,740 | 6,290 | 6,081 | 6,190 | 6,050 | 7,531 |
| Côte-Saint-Luc | 31,450 | 33,550 | 31,945 | 32,539 | 32,228 | 36,989 |
| Delson | 7,410 | 7,555 | 7,591 | 7,828 | 7,942 | 9,348 |
| Deux-Montagnes | 17,615 | 17,545 | 18,025 | 17,946 | 17,902 | 19,191 |
| Dollard-Des Ormeaux | 49,240 | 50,825 | 47,372 | 48,929 | 49,166 | 50,313 |
| Dorval and L’Île-Dorval | 18,185 | 19,250 | 19,197 | 19,253 | 18,999 | 23,112 |
| Hampstead | 6,995 | 7,500 | 7,382 | 7,179 | 7,531 | 8,585 |
| Hudson | 5,120 | 4,890 | 4,532 | 4,882 | 5,411 | 3,169 |
| Kirkland | 20,575 | 21,215 | 21,043 | 21,251 | 20,973 | 23,788 |
| La Prairie | 22,040 | 23,975 | 23,569 | 23,364 | 23,098 | 28,357 |
| L’Assomption | 16,940 | 19,755 | 19,531 | 20,132 | 19,993 | 29,545 |
| Laval | 372,415 | 404,110 | 403,016 | 400,079 | 401,717 | 521,664 |
| Léry | 2,420 | 2,325 | 2,622 | 2,456 | 2,793 | 3,265 |
| Les Cèdres | 5,810 | 5,960 | 5,959 | 6,009 | 5,546 | 6,765 |
| L’Île-Perrot | 10,105 | 10,595 | 10,774 | 10,460 | 10,708 | 13,003 |
| Longueuil | 231,585 | 236,755 | 236,858 | 235,889 | 235,395 | 249,684 |
| Lorraine | 9,685 | 9,420 | 9,437 | 9,461 | 9,439 | 9,780 |
| Mascouche | 34,305 | 40,960 | 41,288 | 40,776 | 41,969 | 59,383 |
| McMasterville | 5,290 | 5,520 | 5,459 | 5,784 | 5,429 | 6,656 |
| Mercier | 10,250 | 11,585 | 10,346 | 10,309 | 10,201 | 13,789 |
| Mirabel | 35,310 | 41,165 | 41,083 | 40,087 | 41,053 | 56,790 |
| Montréal | 1,638,870 | 1,723,940 | 1,704,182 | 1,734,634 | 1,733,374 | 2,070,328 |
| Montréal-Est | 3,865 | 4,010 | 3,963 | 3,910 | 3,903 | 4,088 |
| Montréal-Ouest | 5,225 | 5,395 | 5,095 | 5,171 | 5,250 | 6,143 |
| Mont-Royal | 18,995 | 20,225 | 20,156 | 20,462 | 19,720 | 21,950 |
| Mont-Saint-Hilaire | 15,865 | 17,410 | 18,671 | 18,438 | 18,194 | 23,341 |
| Notre-Dame-de-l’Île-Perrot | 10,030 | 10,430 | 9,826 | 10,153 | 10,099 | 10,910 |
| Oka | 3,310 | 3,700 | 3,373 | 3,510 | 3,252 | 4,031 |
| Otterburn Park | 8,580 | 8,470 | 8,613 | 8,502 | 8,260 | 9,527 |
| Pincourt | 11,375 | 13,690 | 12,928 | 12,456 | 12,793 | 13,812 |
| Pointe-Calumet | 6,645 | 6,455 | 7,148 | 6,425 | 6,754 | 7,386 |
| Pointe-Claire | 30,275 | 31,875 | 30,383 | 30,974 | 29,832 | 34,251 |
| Pointe-des-Cascades | 1,045 | 1,195 | 1,204 | 1,200 | 1,240 | 1,745 |
| Repentigny | 77,035 | 81,275 | 82,040 | 80,413 | 80,882 | 88,566 |
| Richelieu | 5,240 | 5,335 | 5,477 | 5,359 | 5,617 | 6,336 |
| Rosemère | 14,290 | 14,070 | 14,244 | 13,741 | 13,989 | 13,993 |
| Saint-Amable | 8,510 | 10,620 | 9,799 | 9,531 | 9,968 | 14,756 |
| Saint-Basile-le-Grand | 15,825 | 16,550 | 17,025 | 16,027 | 16,511 | 19,267 |
| Saint-Bruno-de-Montarville | 24,515 | 25,965 | 25,842 | 25,518 | 24,908 | 27,933 |
| Saint-Constant | 24,250 | 24,990 | 25,173 | 24,929 | 25,065 | 27,644 |
| Sainte-Anne-de-Bellevue | 5,235 | 5,425 | 5,415 | 5,743 | 5,408 | 7,110 |
| Sainte-Anne-des-Plaines | 13,165 | 13,730 | 12,769 | 12,909 | 12,888 | 13,204 |
| Sainte-Catherine | 16,405 | 16,885 | 17,435 | 17,620 | 17,383 | 22,110 |
| Sainte-Julie | 29,380 | 29,095 | 28,180 | 28,296 | 28,318 | 27,663 |
| Sainte-Marthe-sur-le-Lac | 11,485 | 14,840 | 13,341 | 12,841 | 13,595 | 12,816 |
| Sainte-Thérèse | 25,490 | 26,140 | 27,346 | 27,774 | 27,067 | 34,930 |
| Saint-Eustache | 42,610 | 43,525 | 44,060 | 42,886 | 43,773 | 48,375 |
| Saint-Isidore | 2,520 | 2,640 | 2,765 | 2,662 | 2,821 | 3,332 |
| Saint-Jean-Baptiste | 3,060 | 3,090 | 3,017 | 3,127 | 3,047 | 3,286 |
| Saint-Joseph-du-Lac | 5,035 | 6,245 | 6,437 | 6,730 | 6,490 | 9,209 |
| Saint-Lambert | 21,660 | 22,015 | 23,242 | 23,040 | 22,953 | 22,794 |
| Saint-Lazare | 17,260 | 18,980 | 19,040 | 19,279 | 19,452 | 24,881 |
| Saint-Mathias-sur-Richelieu | 4,570 | 4,465 | 4,376 | 4,579 | 4,523 | 4,691 |
| Saint-Mathieu | 1,890 | 1,990 | 1,929 | 1,823 | 1,827 | 2,173 |
| Saint-Mathieu-de-Beloeil | 2,315 | 2,545 | 2,398 | 2,524 | 2,763 | 3,327 |
| Saint-Philippe | 5,180 | 5,630 | 6,015 | 6,073 | 5,921 | 8,717 |
| Saint-Sulpice | 3,355 | 3,290 | 3,441 | 3,414 | 3,244 | 3,818 |
| Senneville | 980 | 985 | 897 | 1,107 | 974 | 967 |
| Terrasse-Vaudreuil | 2,000 | 1,925 | 2,034 | 1,895 | 1,958 | 2,031 |
| Terrebonne | 96,175 | 106,310 | 106,699 | 104,761 | 106,534 | 171,084 |
| Varennes | 21,175 | 20,680 | 22,028 | 21,518 | 21,476 | 23,841 |
| Vaudreuil-Dorion | 26,195 | 32,555 | 32,178 | 32,107 | 32,080 | 47,454 |
| Vaudreuil-sur-le-Lac and L’Île-Cadieux | 1,425 | 1,490 | 1,551 | 1,630 | 1,426 | 1,768 |
| Verchères and Calixa-Lavallée | 5,835 | 5,995 | 6,161 | 6,332 | 6,313 | 8,022 |
| Westmount | 20,580 | 21,280 | 21,136 | 21,240 | 21,159 | 18,427 |
-
Source: Institut de la statistique du Québec (2006 and 2011 population estimates); Authors calculation (simulations).
Footnotes
1.
We used MMC rather than the census metropolitan area (CMA) defined by Statistics Canada because urban planning is developed at the MMC level and some important variables used in this study come from this planning exercise. However, municipalities common to both cover 97% of the CMA population and 98% of the MMC.
2.
Three municipalities were aggregated to an adjacent municipality because of their small population size: Calixa-Lavallée with Verchères; l’Île-Dorval with Dorval; l’Île-Cadieux with Vaudreuil-sur-le-Lac.
3.
County-like political entities.
4.
Confidential microdata files from Statistics Canada surveys, including censuses, are made available in Statistics Canada’s Research Data Centers.
5.
The correction factors vary from 0.528 to 1.888.
6.
The Charter of the French Language has been adopted in 1977 and the province of Quebec can select its immigrants since 1978. Under the Charter, most immigrants’ children have to go into a French public school and Quebec’s immigrant selection criteria favor French speaking immigrants. These two factors have drastically changed the language shift patterns of immigrants over time.
7.
We took the difference in the total number of housings (occupied or not) between the two censuses divide by 5.
8.
The long form of the Canadian Census has been replaced the National Household Survey which was not mandatory. Non-response rates vary between population groups, in consequence, the non-response bias is likely to be much larger than for the traditional mandatory census and perhaps larger than the error of the projection model.
References
-
1
Residential Choice from a Lifestyle PerspectiveHousing, Theory and Society 23:109–130.
-
2
Building a dynamic spatial microsimulation model for IrelandPopulation, Space and Place 11:157–172.
-
3
Geography Matters: Simulating the Local Impacts of National Social PoliciesJ. R. Foundation. York, University of Leeds.
-
4
Rapport sur l’état de la population du Canada135–161, La fécondité des immigrantes et de leurs filles au Canada, Rapport sur l’état de la population du Canada, Ottawa, Statistique Canada.
-
5
Social Statistics Speakers Series MontrealProjecting the ethnocultural composition of the population using a microsimulation model, Social Statistics Speakers Series Montreal, University McGill.
-
6
Projections démographiques localisées: une réflexion sur la compatibilité des démarchesCahiers de démographie locale pp. 9–32.
-
7
The Generation of Individual and Household Incomes at the Small Area Level using SynthesisRegional Studies 23:535–548.
-
8
L’effet de la « sélection d’immigrants en bonne santé » sur la mortalité canadienne aux grands âgesCahiers québécois de démographie 31:249–274.
-
9
Canadians et Canadiens. Étude sur l’histoire et la pensée des deux CanadasMontréal et Paris, Fides.
-
10
Lessons from stochastic small-area population projections: the case of Waikato subregions in New ZealandJournal of Population Research 28:245–265.
-
11
Tout est-il joué avant l’arrivée? Étude de facteurs associés à un usage prédominant du français ou de l’anglais chez les immigrants allophones arrivés au Québec adultesConseil supérieur de la langue française.
- 12
-
13
Small-area population forecasting in an urban setting: a spatial regression approachJournal of Population Research 28:185–201.
-
14
Pourquoi et comment tenir compte du logement dans les projections de populations localesCahiers de démographie locale pp. 99–114.
-
15
The Timing of Household Events and Housing Events in the Netherlands: A Longitudinal PerspectiveHousing Studies 17:773–792.
- 16
-
17
La migration des jeunes. Aux frontières de l’espace et du temps81–105, L’intégration des jeunes à la ville : une dynamique de repérage spatial et social, La migration des jeunes. Aux frontières de l’espace et du temps, L. P. and M. Molgat, Québec, es Presses de l’Université Laval.
-
18
Changing families and changing mobility: Their impact on the central cityDemography 19:261–277.
- 19
- 20
-
21
A Short Method for Projecting Population By Age from One Decennial Census to AnotherSocial Forces 41:163–170.
-
22
Demographic change and the needs-based planning of government services: projecting small area populations using spatial microsimulationJournal of Population Research 28:203–224.
-
23
Perspectives démographiques du Québec et des régions, 2006–2056 (Édition 2009)Québec, Institut de la statistique du Québec.
-
24
Projection de la population des municipalités, 2009–2024
- 25
-
26
Projection, Forecast, and Plan On the Future of Population ForecastingJournal of the American Planning Association 50:208–221.
-
27
Housing as a Way of Life: Towards an Understanding of Middle-Class Families’ Preference for an Urban Residential LocationHousing Studies 22:83–98.
-
28
Central-city and suburban migration patterns: Is a turnaround on the horizon?Housing Policy Debate 8:307–358.
- 29
-
30
Life Cycle and Environmental Factors in Selecting Residential and Job LocationsHousing Studies 20:457–473.
-
31
Constraints, Satisfaction and Residential Mobility: Speare’s Model ReconsideredDemography 22:199–222.
-
32
’Toward a systematic, argument-based approach to defining assumptions for population projections’Laxenburg: International Institute for Applied Systems Analysis.
-
33
De la banlieue à la ville centre: déterminants de la mobilité résidentielle des banlieusards de MontréalCanadian Journal of Urban Research 22:45–68.
-
34
Déterminants de la migration résidentielle de la ville centre vers la banlieue dans la région métropolitaine de Montréal: clivage linguistique et fuite des francophonesCanadian Geographer/Géographe canadien 58:141–159.
- 35
-
36
Insights into the ‘healthy immigrant effect’: health status and health service use of immigrants to CanadaSocial science & medicine 59:1613–1627.
-
37
Perspectives démographiques pour le canton de VaudCahiers de démographie locale pp. 149–183.
-
38
Tendances sociales canadiennesTendances sociales canadiennes, Ottawa, Statistique Canada,. No 11-008 au catalogue.
-
39
Evaluating Small-Area Population ProjectionsJournal of the American Planning Association 57:432–443.
- 40
- 41
-
42
Estimating and projecting the populations of urban communitiesEnvironment and Planning A 26:1671–1697.
-
43
A framework for progressively improving small area population estimatesJournal of the Royal Statistical Society: Series A (Statistics in Society 167:5–36.
- 44
-
45
Microsimulation of language use at home in a multilingual region with high immigration3rd General Conference of the International Microsimulation Association.
-
46
Perspectives de population et de ménages des communes belgesCahiers de démographie locale pp. 111–148.
-
47
Maurice Séguin, historien du pays québécois vu par ses contemporains81–220, Maurice Séguin, historien du pays québécois vu par ses contemporains, R. Comeau. Montréal, VLB.
-
48
Combining Sample and Census Data in Small Area Estimates: Iterative Proportional Fitting with Standard Software*The Professional Geographer 57:222–234.
-
49
An Evaluation of Population Projection Errors for Census TractsJournal of the American Statistical Association 90:64–71.
-
50
Residential mobility between cities and suburbs: race, suburbanization, and back-to-the-city movesDemography 34:525–538.
- 51
-
52
The Encyclopedia of Life Support Systems, Demography Volume. Y. ZengApplied demography: Its business and public sector components, The Encyclopedia of Life Support Systems, Demography Volume. Y. Zeng, Oxford, England, UNESCO-EOLSS Publishers.
-
53
Forecasting the Population of Census Tracts by Age and Sex: An Example of the Hamilton–Perry Method in ActionPopulation Research and Policy Review 29:47–63.
-
54
Perspectives démolinguistiques du Québec et de la région de Montréal, 2006–2056Office québécois de la langue française.
-
55
Migration entre municipalité centrale et municipalités avoisinantes à Toronto, Montréal et Vancouver. Tendances sociales canadiennesMigration entre municipalité centrale et municipalités avoisinantes à Toronto, Montréal et Vancouver. Tendances sociales canadiennes, Statistique Canada.
-
56
Économie et langue: recueil de textes, Center de recherche en développement économiqueUniversité de Montréal.
-
57
Queensland Centre for Population Research, School of Geography, Planning and Environmental ManagementA Review of Sub-Regional Population Projection Methods, Queensland Centre for Population Research, School of Geography, Planning and Environmental Management, The University of Queensland.
-
58
The Dynamics of Residential Segregation in Buffalo: An Agent-based SimulationUrban Studies 46:2749–2770.
Article and author information
Author details
Publication history
- Version of Record published: April 30, 2014 (version 1)
Copyright
© 2014, Marois and Bélanger
This article is distributed under the terms of the Creative Commons Attribution License, which permits unrestricted use and redistribution provided that the original author and source are credited.