The Growth and Poverty Impacts of Trade Liberalization in Senegal
- Université Laval, Pavillon J-A DeSève, Quebec, Canada
- Monash University, Centre of Policy Studies, Australia
Abstract
Most empirical studies find relatively small welfare and poverty impacts of trade liberalization, mainly as a result of the static framework generally used, in which welfare gains and poverty impacts result solely from a short term reallocation of resources. Using Senegal as a case study, we illustrate the results of integrating the growth and productivity gain effects of trade liberalization with the resulting long-run impacts on welfare and poverty. We show that the distributional impacts between poor and non-poor depend upon the specific nature of the trade liberalization policies adopted; and the characteristics of the economy in which it occurs. In the Senegalese case, the predicted principal beneficiaries of trade liberalization are urban and higher skill workers.
1. Introduction
Most empirical studies find relatively small welfare and poverty impacts of trade liberalization. This result is not very surprising as, in a static framework, which is generally used, welfare gains and poverty impacts result solely from a short term reallocation of resources. However, there is strong evidence that openness to international trade creates a more competitive environment, and stimulates the diffusion of new technologies, innovation, the adoption of new methods of production and an increase in the availability of imported inputs.1 It is also argued that in the presence of firm heterogeneity, increased trade will lead to a rationalization of output toward the most productive firms.2 All of these factors lead to important productivity and efficiency gains that are not captured in a static analysis.
We contribute to this literature by integrating the growth effects of trade liberalization and the resulting long-run impacts on welfare and poverty. In other words, the question we are trying to answer is, if such productivity gains occur as a result of trade liberalization, who would benefit the most from it. While the existing literature tries to draw general conclusions to questions such as “Is growth good for the poor?”, “Does trade liberalization increase growth?”, “Is trade liberalization pro-poor?”, our analysis allows us to dig deeper to see that these relationships depend on the specific nature of the trade liberalization policies and the characteristics of the economy in which it occurs.3
2. Context
Senegal is engaged in the process of liberalizing its external trade under various - unilateral, bilateral, and multilateral - trade negotiations. The import-substitution and export-subsidy policies adopted after independence were slowly removed from 1980 onwards in the context of various structural adjustment programs in the hope of encouraging more efficient resource allocation. While increased trade might benefit Senegal as a whole, there is a growing concern about its distributional impacts between poor and non-poor. Although the assessment of the impacts of trade liberalization on the Senegalese economy and population has received some interest in the literature4, none of the previous analysis has focused on the distributional impacts of trade liberalization policies in the presence of productivity gains.
Macro analysis
Using a sequential dynamic CGE model of Senegal5 we simulated a complete unilateral elimination of tariffs. The study uses the 2004 Social Accounting Matrix (SAM) that includes 35 industries (six primary, 19 industrial and 10 in services), eight productive factors, and one representative household. Gender (male and female), geographical (urban and rural), and skill (educated and uneducated) dimensions are used to break down labour into six categories. As imports become cheaper, their demand increases and demand for competing domestic production falls. In the face of a foreign savings (or current account balance) constraint, increased imports must be matched by increased exports through a depreciation of the real exchange rate. Sectoral impacts thus differ depending on whether a sector competes with imports or whether its production is oriented towards the export market. Hence, the initial structure of the national economy is of great importance. In our model, the productivity of each sector is a function of its openness to trade, which we capture by introducing an empirically-estimated trade-productivity elasticity (Martens, 2007). Results of this simulation suggest that the productivity channel substantially boosts growth and generally accentuates the sectoral impacts. Table 1 shows that the industrial sectors faced the highest initial tariffs and accounted for the majority of total exports and imports. However, services account for close to 60 percent of value-added and an important part, mainly tourism, is export-oriented.
Key characteristics of external trade (percent).
| Share | Ratio | Tariff rates | ||||
|---|---|---|---|---|---|---|
| Value added | Imports | Exports | Imports/ Consumption | Exports/ Output | ||
| Primary | 15.7 | 19.3 | 9.3 | 26.2 | 8.5 | 7.1 |
| Industrial | 25.7 | 72.9 | 54.5 | 44.4 | 18.6 | 16.7 |
| Services | 58.6 | 7.8 | 36.2 | 8.4 | 18.1 | 0.0 |
| All | 100.0 | 100.0 | 100.0 | 30.9 | 18.4 | 13.6 |
-
Source: Cockburn et al. (2010).
Impacts on demand, output and prices (percent).
| Volumes | Prices | |||||||||
|---|---|---|---|---|---|---|---|---|---|---|
| Imports | Dom. sales | Exports | Output | Value added | Imports | Dom. sales | Exports | Output | Value added | |
| Primary | 8.4 | 2.6 | 18.1 | 4.3 | 3.6 | −4.4 | −3.2 | 0.0 | −4.7 | −5.9 |
| Industrial | 16.3 | 0.5 | 19.8 | 4.2 | 5.5 | −12.9 | −2.3 | 0.0 | −3.6 | −4.3 |
| Services | 0.3 | 2.8 | 15.4 | 4.4 | 3.4 | 1.8 | 1.5 | 0.0 | −0.5 | 0.5 |
| TOTAL | 13.7 | 1.8 | 18.2 | 4.3 | 3.9 | −10.3 | −0.8 | 0.0 | −2.4 | −1.8 |
-
Source: Cockburn et al. (2010).
Impacts on income and rates of return to factors (percent).
| Initial share in total income | Change in rates of return to factors | |
|---|---|---|
| Labor income | 40.9 | −0.4 |
| Total male | 28.4 | −0.4 |
| Rural | 12.1 | −2.3 |
| Urban | 16.3 | 1.0 |
| -unskilled | 7.0 | −1.2 |
| -skilled | 9.3 | 3.9 |
| Total female | 12.5 | −0.8 |
| Rural | 4.5 | −2.4 |
| Urban | 8.0 | 0.2 |
| -unskilled | 2.3 | −1.4 |
| -skilled | 5.7 | 4.1 |
| Capital | 29.7 | −3.0 |
| Non-factor income | 29.5 | −4.3 |
| Total household income | 100.0 | −2.0 |
| Consumer price index | −6.7 |
-
Source: Cockburn et al. (2010).
As would be expected, trade liberalization leads to a reallocation of resources in favour of the export-oriented sectors (meat products, chemical, rubber and leather products, etc.) and to the detriment of their import-competing counterparts (transport material, machinery, paper product, textiles etc.). As there is a similar mix of these two types of sectors in both the primary and industrial sectors, there is no major difference in their aggregate results. The primary and services sector expand slightly more than the industrial sector. However, value added prices in the agricultural sector fall 25 percent more than in the industrial sector and three times more than in the services sector. This divergence in the behaviour of valueadded prices is linked both to the fall in output prices and to the degree of mobility of the factors of production used.6
Rural labour is concentrated in the three main agricultural sectors (subsistence agriculture, cash crop, livestock). In contrast, urban workers have more scope to migrate from the contracting import-competing sectors to the expanding export-oriented and service sectors, such that their wage rates fall much less. Similarly, among urban workers, skilled wages fall less than unskilled wages, as skilled workers are employed proportionately more in the expanding service sectors.
Impacts on poverty are driven by both the fall in incomes and the fall in consumer prices. Depending on the income and the consumption patterns, this impact differs across households.
4. Micro model
Following Ravallion and Lokshin (2004), we build a simple non behavioural (micro accounting) micro-simulation model in order to obtain a first-order approximation of the poverty impacts of full trade liberalization in Senegal over the full 15-year simulation period. Underlying data are obtained from the 2001/2002 Senegalese household survey (“Enquête Sénégalaise Auprès des Ménages 2”).7 Household consumption data are aggregated according to the product categories appearing in the CGE model. On the income side, household capital endowments are grouped into agriculture and non agriculture capital, as in the CGE model. In the same way, labour incomes are grouped according to the location, gender and skill level. The structure of other expenditures and income are also grouped to correspond to the structure in the CGE model. The average tax and saving rates of households are taken from the CGE model, but the microsimulation model adds a fixed household specific savings and tax parameter to capture household heterogeneity.
The variations in all factor prices generated by the CGE simulations are used to calculate income variations for all households in the microsimulation model. Given fixed average savings and income tax rates, and the average variation in all net transfers, which are simply indexed to an economy-wide price index, we then calculate the change in total consumption for each household. Consumption values are finally deflated by the change in household-specific consumption price indices (CPI), which are indices of consumer prices from the CGE model that are weighted by the budget share of each product in each household’s total consumption. The poverty line is kept constant as we already deflated consumption values by the CPIs. Base year and post-simulation values for household consumption are then used to calculate corresponding poverty and inequality measures.
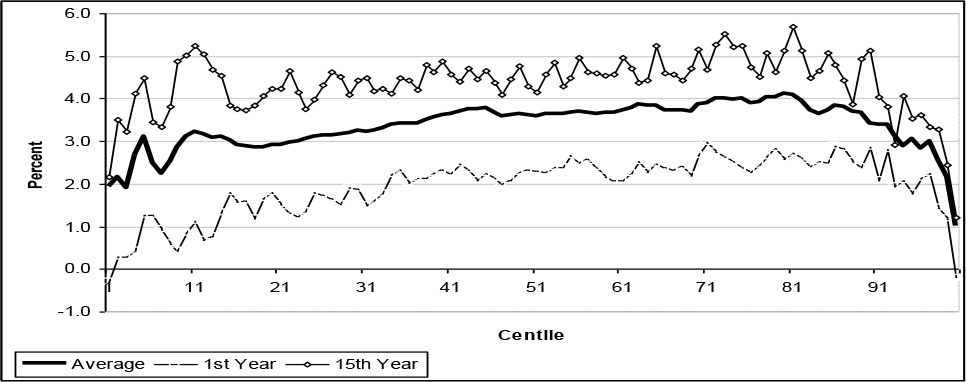
Before examining our poverty indicators, we look more broadly at the distribution of the gains across the whole distribution. Figure 1 depicts the change in the per capita consumption – deflated by the household-specific consumer price indices – for each centile. The average percent variation in consumption is computed for the 15 periods in both the reference (no trade liberalization) and the full trade liberalization scenario. The difference, in percentage points, between these average variations is then calculated for each decile to obtain the growth incidence curve (GIC) in Figure 1. This curve is shown for the 1st and last years of the simulation and on average over the whole simulation period.

Growth incidence curves for Senegal (consumption).
Source: Cockburn et al. (2010).
The GIC is generally concave indicating that middle income households benefit relatively more from unilateral trade liberalization. In the first year, the very poorest and the very richest households both experience a reduction in consumption relative to reference scenario without liberalization, whereas the moderately poor generally benefit less than their richer counterparts. However, the situation of the poorest deciles improves markedly by the 15th year with the gain reaching up to above five percent. The long-term effects are roughly double the short-term effects and tend to favour the lower deciles in comparison to higher deciles. This is due to their greater reliance on labour income in a context where wages increase relative to capital and non-factor income in the long-term.
We now focus specifically on the poorest through the analysis of a series of poverty measures. We first note that the incidence of poverty (the headcount index) falls steadily from 51.5 to 34.4 percent over the reference no-liberalization scenario (Figure 2). The simulated elimination of import tariffs (SIM) is shown to reduce the incidence of poverty in the first year from 51.5 to 50.1 percent, i.e. a fall of 1.4 percentage points. Furthermore, the incidence of poverty declines continuously relative to the reference (or Business-as-Usual; BAU) scenario over the rest of the simulation period, finally settling at 2.0 percentage points lower (34.4 vs. 32.4 percent).
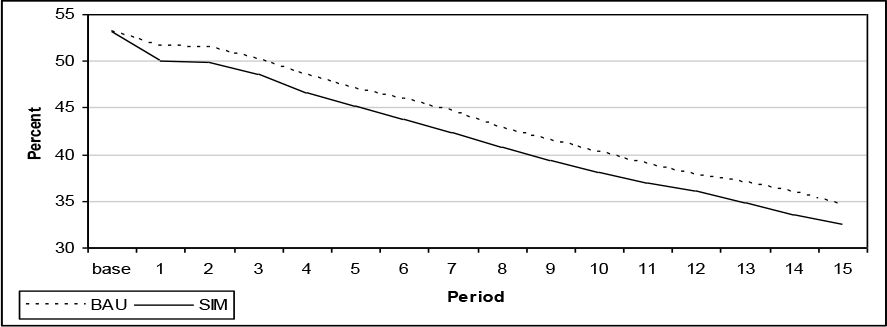
Change in poverty incidence (percent).
Source: Cockburn et al. (2010).
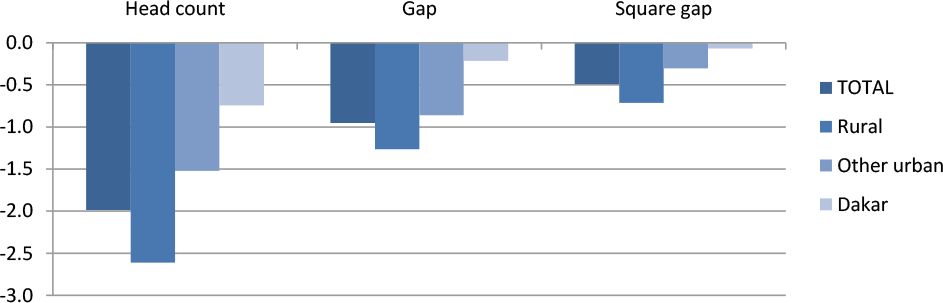
Let us now broaden our analysis to examine changes in the depth and severity of poverty, as measured by the poverty gap (P1) and the squared poverty gap (P2), respectively. Figure 3 shows an improvement of all measures, but the decrease is smaller for P1 and P2 than the reduction in poverty incidence. This confirms our earlier finding that the poorest deciles gain relatively less compared with the middle income deciles.

Change in poverty measures (in percentage points).
Source: Cockburn et al. (2010).
Figure 3 also shows that trade liberalization in Senegal would reduce rural poverty more than in urban areas. While the fall in the relative wages of rural workers would initially lead us to believe that rural households would lose the most from trade liberalization, they are in fact compensated by greater consumer price savings, given that they consume more goods from the initially protected agricultural and agro-industrial sectors, whereas urban households, particularly in Dakar, consume more services, for which prices fall only moderately.
5. Conclusion
By introducing a productivity parameter linked to the degree of openness, the CGE model presented in this case study produced the expected results: gains from trade liberalization are indeed greater than they would have been otherwise. Improvement in labour productivity has, however, important consequences on income distribution and poverty. In fact, sectors that show the greatest improvement in productivity are those for which imports and/or exports have increased. In the case of decreasing production for import-competing industries, the negative impact on labour demand will be enhanced if less workers are required to produce the same output. The converse is true for the export gaining sectors.
Using a microsimulation model, we evaluated the net overall impact on poverty. Results show that workers who can find work relatively more easily would benefit the most from trade liberalization. In the Senegalese case, these are the workers with higher skills and the ones who live in urban areas.
Footnotes
1.
For a compact elaboration on these issues see Kim (2000), Keller (2000), and Winters (2004).
2.
For important contributions in this area see, among others, Melitz (2003), Bernard et al. (2003), Helpman et al. (2004), Baldwin (2005), Baldwin and Robert-Nicoud (2006), and Gustafsson and Segerstrom (2007).
3.
See for example Cockburn et al. (2008)
4.
See for example Cockburn et al. (2007)
5.
See Cockburn et al. (2010) for a complete description of the model
6.
At each period, the stock of capital is sector specific but changes from one period to the next due to depreciation and investment made in each sector. All types of are perfectly mobile across sectors in which they were used initially.
7
As the 2001/2001 survey does not present data on the sources of income, the household survey from 1955 was used to estimate income patterns.
References
-
1
Heterogeneous firms and trade: testable and untestable properties of the Melitz model. NBER Working Paper 11471Cambridge: National Bureau of Economic Research (NBER).
-
2
Trade and growth with heterogeneous firms. CEP Discussion Paper No 727London: Centre for Economic Performance (CEP), London School of Economics.
- 3
-
4
Future Trade Research Areas That Matter To Developing Country PolicymakersTrade Liberalization and Poverty - Lessons from Africa and Asia, Trade and Investment Division (United Nations Economic Commission for Asia and the Pacific (UNESCAP)), Future Trade Research Areas That Matter To Developing Country Policymakers, Studies in Trade and Investment 61, Bangkok, UNESCAP, http://www.unescap.org/publications/detail.asp?id=1254.
-
5
Gender Aspects of the Trade and Poverty Nexus - A Macro-Micro ApproachTrade, Growth and Gender in Developing Countries: Comparison of Ghana, Honduras, Senegal and Uganda, Gender Aspects of the Trade and Poverty Nexus - A Macro-Micro Approach, World Bank, Washington DC.
-
6
The Gender and Poverty Impacts of Trade Liberalization in Senegal. Working Paper 10-13Québec: Centre interuniversitaire sur le risque, les politiques économiques et l’emploi (CIRPÉE).
-
7
Trade liberalization and productivity growth. CEPR Discussion Paper No 5894London: Centre for Economic Policy Research (CEPR).
- 8
-
9
Do trade patterns and technology flows affect productivity growth?The World Bank Economic Review 14:117–47.
-
10
Trade liberalization and productivity growth in Korean manufacturing industries: price protection, market power, and scale efficiencyJournal of Development Economics 61:55–83.
- 11
-
12
The impact of trade on intra-industry reallocations and aggregate industry productivityEconometrica 71:1695–1726.
-
13
Gainers and losers from Trade Reform in Morocco. World Bank Policy Research Working Paper. No. 3368Washington, DC.: The World Bank.
-
14
Trade liberalization and economic performance: an overviewThe Economic Journal 114:F4–F21.
Article and author information
Author details
Acknowledgements
Funding for this study was provided by the World Bank-Netherlands Partnership Program (BNPP) and the Poverty and Economic Policy (PEP) research network, which is financed by the Government of Canada through the International Development Research Centre (IDRC) and the Canadian International Development Agency (CIDA), and by the Australian Agency for International Development (AusAID). Our thanks to André Martens for his review of the empirical literature on trade, FDI and growth. We also thank Maurizio Bussolo, André Martens and Rafael de Hoyos for comments and suggestions. Acknowledgments to Joseph Cabral and Fatou Cissé for help in obtaining country data and information.
Publication history
- Version of Record published: June 30, 2010 (version 1)
Copyright
© 2010, Cockburn et al.
This article is distributed under the terms of the Creative Commons Attribution License, which permits unrestricted use and redistribution provided that the original author and source are credited.